Osage vs Immigrants from Chile Single Father Households
COMPARE
Osage
Immigrants from Chile
Single Father Households
Single Father Households Comparison
Osage
Immigrants from Chile
2.5%
SINGLE FATHER HOUSEHOLDS
4.1/ 100
METRIC RATING
242nd/ 347
METRIC RANK
2.2%
SINGLE FATHER HOUSEHOLDS
96.7/ 100
METRIC RATING
130th/ 347
METRIC RANK
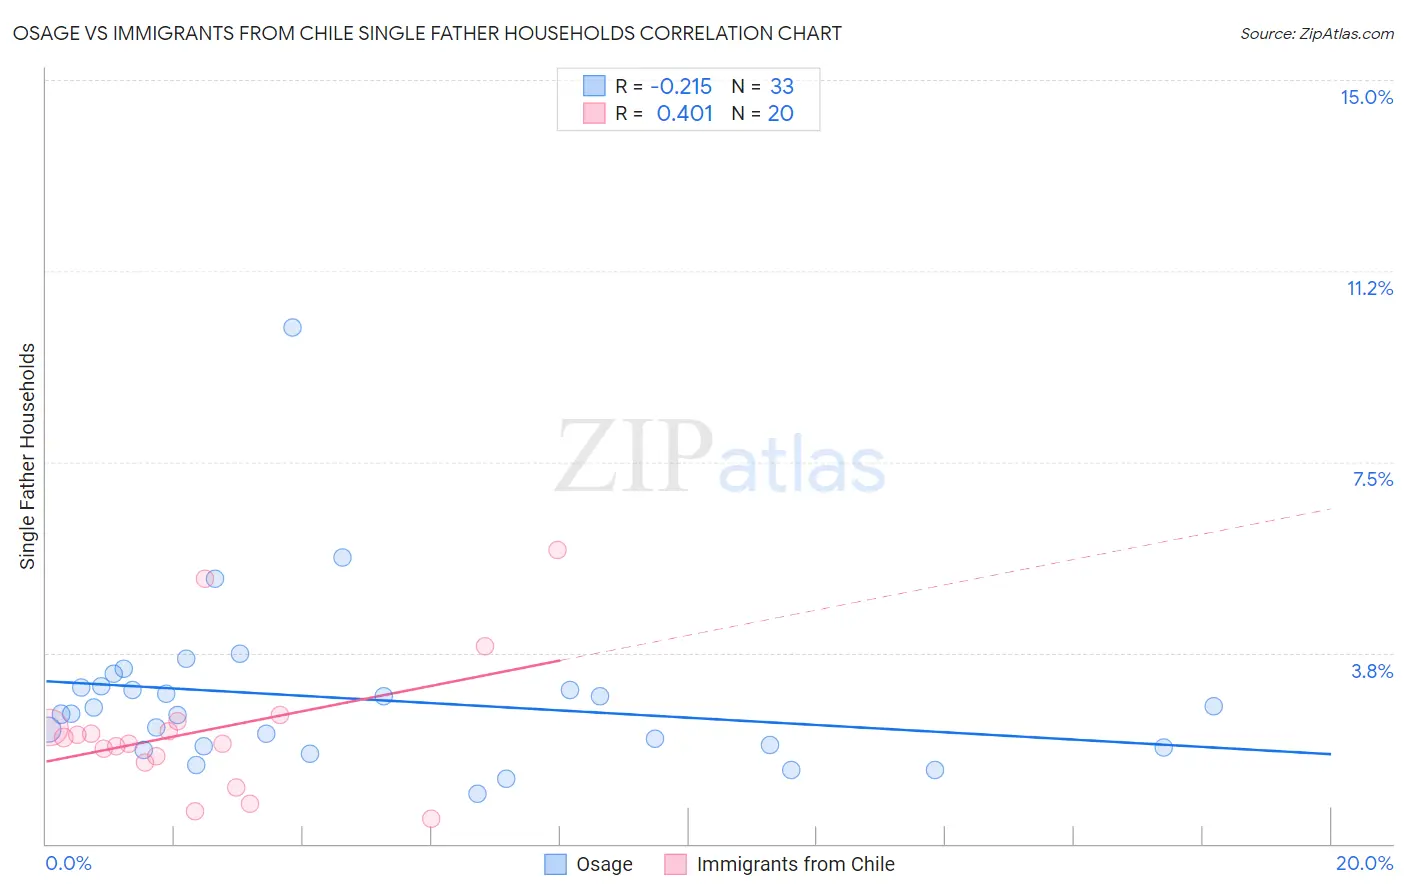
Osage vs Immigrants from Chile Single Father Households Correlation Chart
The statistical analysis conducted on geographies consisting of 91,601,275 people shows a weak negative correlation between the proportion of Osage and percentage of single father households in the United States with a correlation coefficient (R) of -0.215 and weighted average of 2.5%. Similarly, the statistical analysis conducted on geographies consisting of 217,839,905 people shows a moderate positive correlation between the proportion of Immigrants from Chile and percentage of single father households in the United States with a correlation coefficient (R) of 0.401 and weighted average of 2.2%, a difference of 12.8%.
Single Father Households Correlation Summary
| Measurement | Osage | Immigrants from Chile |
| Minimum | 0.98% | 0.50% |
| Maximum | 10.1% | 5.8% |
| Range | 9.2% | 5.3% |
| Mean | 2.8% | 2.2% |
| Median | 2.6% | 2.0% |
| Interquartile 25% (IQ1) | 1.9% | 1.7% |
| Interquartile 75% (IQ3) | 3.1% | 2.3% |
| Interquartile Range (IQR) | 1.2% | 0.69% |
| Standard Deviation (Sample) | 1.6% | 1.3% |
| Standard Deviation (Population) | 1.6% | 1.3% |
Similar Demographics by Single Father Households
Demographics Similar to Osage by Single Father Households
In terms of single father households, the demographic groups most similar to Osage are Portuguese (2.5%, a difference of 0.030%), Immigrants from Dominica (2.5%, a difference of 0.29%), Spaniard (2.5%, a difference of 0.46%), Immigrants from Oceania (2.5%, a difference of 0.65%), and Immigrants from Middle Africa (2.5%, a difference of 0.65%).
| Demographics | Rating | Rank | Single Father Households |
| Immigrants | Immigrants | 6.3 /100 | #235 | Tragic 2.5% |
| Cajuns | 6.1 /100 | #236 | Tragic 2.5% |
| Sierra Leoneans | 5.9 /100 | #237 | Tragic 2.5% |
| Immigrants | Sierra Leone | 5.8 /100 | #238 | Tragic 2.5% |
| Immigrants | Oceania | 5.8 /100 | #239 | Tragic 2.5% |
| Immigrants | Dominica | 4.8 /100 | #240 | Tragic 2.5% |
| Portuguese | 4.1 /100 | #241 | Tragic 2.5% |
| Osage | 4.1 /100 | #242 | Tragic 2.5% |
| Spaniards | 3.1 /100 | #243 | Tragic 2.5% |
| Immigrants | Middle Africa | 2.8 /100 | #244 | Tragic 2.5% |
| Basques | 2.5 /100 | #245 | Tragic 2.5% |
| Native Hawaiians | 2.5 /100 | #246 | Tragic 2.5% |
| Delaware | 2.5 /100 | #247 | Tragic 2.5% |
| Bahamians | 2.4 /100 | #248 | Tragic 2.5% |
| Immigrants | Cameroon | 2.3 /100 | #249 | Tragic 2.5% |
Demographics Similar to Immigrants from Chile by Single Father Households
In terms of single father households, the demographic groups most similar to Immigrants from Chile are Immigrants from Jordan (2.2%, a difference of 0.060%), Polish (2.2%, a difference of 0.070%), Serbian (2.2%, a difference of 0.11%), Immigrants from England (2.2%, a difference of 0.12%), and Moroccan (2.2%, a difference of 0.17%).
| Demographics | Rating | Rank | Single Father Households |
| Immigrants | Yemen | 97.5 /100 | #123 | Exceptional 2.2% |
| British West Indians | 97.4 /100 | #124 | Exceptional 2.2% |
| Immigrants | Indonesia | 97.4 /100 | #125 | Exceptional 2.2% |
| Moroccans | 96.9 /100 | #126 | Exceptional 2.2% |
| Jordanians | 96.9 /100 | #127 | Exceptional 2.2% |
| Immigrants | England | 96.8 /100 | #128 | Exceptional 2.2% |
| Serbians | 96.8 /100 | #129 | Exceptional 2.2% |
| Immigrants | Chile | 96.7 /100 | #130 | Exceptional 2.2% |
| Immigrants | Jordan | 96.6 /100 | #131 | Exceptional 2.2% |
| Poles | 96.5 /100 | #132 | Exceptional 2.2% |
| Taiwanese | 96.3 /100 | #133 | Exceptional 2.2% |
| Zimbabweans | 95.1 /100 | #134 | Exceptional 2.2% |
| Syrians | 94.8 /100 | #135 | Exceptional 2.2% |
| Chileans | 94.5 /100 | #136 | Exceptional 2.2% |
| Austrians | 94.2 /100 | #137 | Exceptional 2.2% |