Norwegian vs Immigrants from Chile Disability Age 5 to 17
COMPARE
Norwegian
Immigrants from Chile
Disability Age 5 to 17
Disability Age 5 to 17 Comparison
Norwegians
Immigrants from Chile
5.7%
DISABILITY AGE 5 TO 17
20.9/ 100
METRIC RATING
198th/ 347
METRIC RANK
5.4%
DISABILITY AGE 5 TO 17
95.0/ 100
METRIC RATING
125th/ 347
METRIC RANK
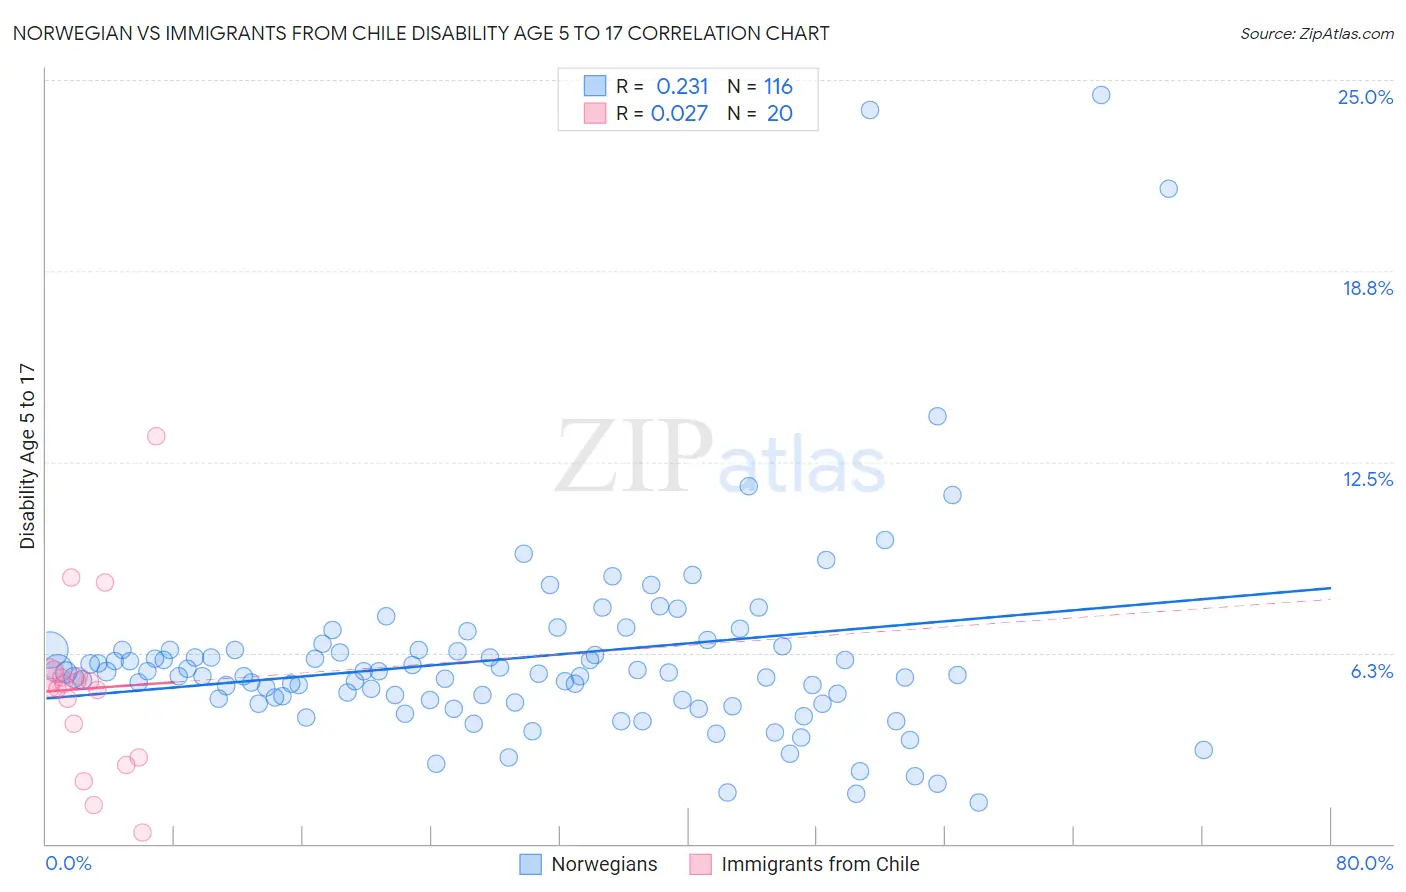
Norwegian vs Immigrants from Chile Disability Age 5 to 17 Correlation Chart
The statistical analysis conducted on geographies consisting of 523,039,839 people shows a weak positive correlation between the proportion of Norwegians and percentage of population with a disability between the ages 5 and 17 in the United States with a correlation coefficient (R) of 0.231 and weighted average of 5.7%. Similarly, the statistical analysis conducted on geographies consisting of 217,781,559 people shows no correlation between the proportion of Immigrants from Chile and percentage of population with a disability between the ages 5 and 17 in the United States with a correlation coefficient (R) of 0.027 and weighted average of 5.4%, a difference of 5.5%.
Disability Age 5 to 17 Correlation Summary
| Measurement | Norwegian | Immigrants from Chile |
| Minimum | 1.4% | 0.37% |
| Maximum | 24.5% | 13.3% |
| Range | 23.2% | 13.0% |
| Mean | 6.1% | 5.1% |
| Median | 5.5% | 5.2% |
| Interquartile 25% (IQ1) | 4.7% | 3.4% |
| Interquartile 75% (IQ3) | 6.3% | 5.5% |
| Interquartile Range (IQR) | 1.6% | 2.1% |
| Standard Deviation (Sample) | 3.4% | 2.8% |
| Standard Deviation (Population) | 3.4% | 2.8% |
Similar Demographics by Disability Age 5 to 17
Demographics Similar to Norwegians by Disability Age 5 to 17
In terms of disability age 5 to 17, the demographic groups most similar to Norwegians are Immigrants from North America (5.7%, a difference of 0.16%), Inupiat (5.7%, a difference of 0.17%), Immigrants from Nigeria (5.7%, a difference of 0.18%), Croatian (5.7%, a difference of 0.19%), and Immigrants from Canada (5.7%, a difference of 0.35%).
| Demographics | Rating | Rank | Disability Age 5 to 17 |
| Danes | 26.5 /100 | #191 | Fair 5.7% |
| Immigrants | Bosnia and Herzegovina | 26.3 /100 | #192 | Fair 5.7% |
| Immigrants | Canada | 26.1 /100 | #193 | Fair 5.7% |
| Croatians | 23.6 /100 | #194 | Fair 5.7% |
| Immigrants | Nigeria | 23.4 /100 | #195 | Fair 5.7% |
| Inupiat | 23.3 /100 | #196 | Fair 5.7% |
| Immigrants | North America | 23.1 /100 | #197 | Fair 5.7% |
| Norwegians | 20.9 /100 | #198 | Fair 5.7% |
| Northern Europeans | 15.2 /100 | #199 | Poor 5.7% |
| Icelanders | 14.6 /100 | #200 | Poor 5.7% |
| Basques | 13.7 /100 | #201 | Poor 5.7% |
| Austrians | 13.2 /100 | #202 | Poor 5.7% |
| Spanish American Indians | 12.8 /100 | #203 | Poor 5.7% |
| Paiute | 11.2 /100 | #204 | Poor 5.7% |
| Trinidadians and Tobagonians | 10.8 /100 | #205 | Poor 5.7% |
Demographics Similar to Immigrants from Chile by Disability Age 5 to 17
In terms of disability age 5 to 17, the demographic groups most similar to Immigrants from Chile are Crow (5.4%, a difference of 0.010%), New Zealander (5.4%, a difference of 0.010%), Latvian (5.4%, a difference of 0.010%), Immigrants from Venezuela (5.4%, a difference of 0.13%), and Immigrants from Ethiopia (5.4%, a difference of 0.15%).
| Demographics | Rating | Rank | Disability Age 5 to 17 |
| South Americans | 97.1 /100 | #118 | Exceptional 5.4% |
| Immigrants | South America | 97.1 /100 | #119 | Exceptional 5.4% |
| Immigrants | Immigrants | 97.0 /100 | #120 | Exceptional 5.4% |
| Maltese | 96.0 /100 | #121 | Exceptional 5.4% |
| Chileans | 95.8 /100 | #122 | Exceptional 5.4% |
| Immigrants | Ethiopia | 95.5 /100 | #123 | Exceptional 5.4% |
| Crow | 95.0 /100 | #124 | Exceptional 5.4% |
| Immigrants | Chile | 95.0 /100 | #125 | Exceptional 5.4% |
| New Zealanders | 95.0 /100 | #126 | Exceptional 5.4% |
| Latvians | 95.0 /100 | #127 | Exceptional 5.4% |
| Immigrants | Venezuela | 94.5 /100 | #128 | Exceptional 5.4% |
| Romanians | 94.1 /100 | #129 | Exceptional 5.4% |
| Immigrants | Bulgaria | 94.0 /100 | #130 | Exceptional 5.4% |
| Arabs | 92.9 /100 | #131 | Exceptional 5.4% |
| Immigrants | Colombia | 92.9 /100 | #132 | Exceptional 5.4% |