Osage vs Immigrants from Belize Self-Care Disability
COMPARE
Osage
Immigrants from Belize
Self-Care Disability
Self-Care Disability Comparison
Osage
Immigrants from Belize
2.6%
SELF-CARE DISABILITY
3.6/ 100
METRIC RATING
224th/ 347
METRIC RANK
2.8%
SELF-CARE DISABILITY
0.0/ 100
METRIC RATING
303rd/ 347
METRIC RANK
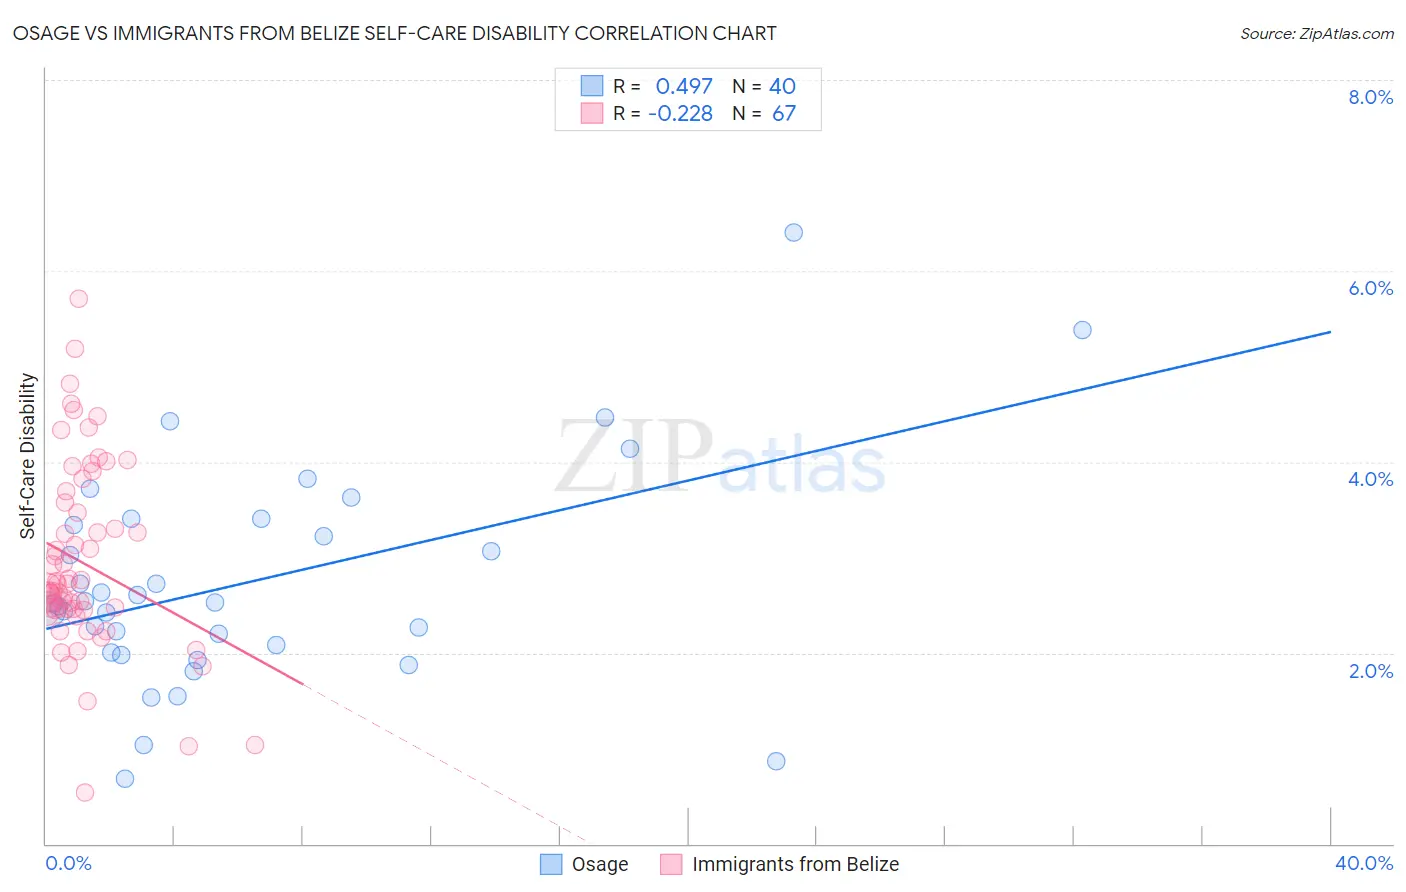
Osage vs Immigrants from Belize Self-Care Disability Correlation Chart
The statistical analysis conducted on geographies consisting of 91,779,212 people shows a moderate positive correlation between the proportion of Osage and percentage of population with self-care disability in the United States with a correlation coefficient (R) of 0.497 and weighted average of 2.6%. Similarly, the statistical analysis conducted on geographies consisting of 130,238,734 people shows a weak negative correlation between the proportion of Immigrants from Belize and percentage of population with self-care disability in the United States with a correlation coefficient (R) of -0.228 and weighted average of 2.8%, a difference of 8.7%.
Self-Care Disability Correlation Summary
| Measurement | Osage | Immigrants from Belize |
| Minimum | 0.68% | 0.53% |
| Maximum | 6.4% | 5.7% |
| Range | 5.7% | 5.2% |
| Mean | 2.7% | 2.9% |
| Median | 2.5% | 2.7% |
| Interquartile 25% (IQ1) | 2.0% | 2.4% |
| Interquartile 75% (IQ3) | 3.4% | 3.6% |
| Interquartile Range (IQR) | 1.3% | 1.1% |
| Standard Deviation (Sample) | 1.2% | 0.98% |
| Standard Deviation (Population) | 1.1% | 0.97% |
Similar Demographics by Self-Care Disability
Demographics Similar to Osage by Self-Care Disability
In terms of self-care disability, the demographic groups most similar to Osage are French Canadian (2.6%, a difference of 0.050%), Spaniard (2.6%, a difference of 0.060%), Honduran (2.6%, a difference of 0.070%), Subsaharan African (2.6%, a difference of 0.11%), and Immigrants from Moldova (2.6%, a difference of 0.12%).
| Demographics | Rating | Rank | Self-Care Disability |
| Celtics | 4.4 /100 | #217 | Tragic 2.6% |
| Scotch-Irish | 4.1 /100 | #218 | Tragic 2.6% |
| Immigrants | Moldova | 4.0 /100 | #219 | Tragic 2.6% |
| Sub-Saharan Africans | 4.0 /100 | #220 | Tragic 2.6% |
| Hondurans | 3.8 /100 | #221 | Tragic 2.6% |
| Spaniards | 3.8 /100 | #222 | Tragic 2.6% |
| French Canadians | 3.8 /100 | #223 | Tragic 2.6% |
| Osage | 3.6 /100 | #224 | Tragic 2.6% |
| Iraqis | 3.2 /100 | #225 | Tragic 2.6% |
| Chinese | 2.9 /100 | #226 | Tragic 2.6% |
| Immigrants | Philippines | 2.7 /100 | #227 | Tragic 2.6% |
| Guatemalans | 2.7 /100 | #228 | Tragic 2.6% |
| Guamanians/Chamorros | 2.5 /100 | #229 | Tragic 2.6% |
| Immigrants | Ecuador | 2.5 /100 | #230 | Tragic 2.6% |
| Immigrants | Guatemala | 2.2 /100 | #231 | Tragic 2.6% |
Demographics Similar to Immigrants from Belize by Self-Care Disability
In terms of self-care disability, the demographic groups most similar to Immigrants from Belize are Immigrants from St. Vincent and the Grenadines (2.8%, a difference of 0.15%), Cree (2.8%, a difference of 0.16%), Pima (2.8%, a difference of 0.18%), Immigrants from West Indies (2.8%, a difference of 0.20%), and Immigrants from Fiji (2.8%, a difference of 0.28%).
| Demographics | Rating | Rank | Self-Care Disability |
| Immigrants | Portugal | 0.0 /100 | #296 | Tragic 2.8% |
| West Indians | 0.0 /100 | #297 | Tragic 2.8% |
| Americans | 0.0 /100 | #298 | Tragic 2.8% |
| Immigrants | Guyana | 0.0 /100 | #299 | Tragic 2.8% |
| Immigrants | Fiji | 0.0 /100 | #300 | Tragic 2.8% |
| Pima | 0.0 /100 | #301 | Tragic 2.8% |
| Immigrants | St. Vincent and the Grenadines | 0.0 /100 | #302 | Tragic 2.8% |
| Immigrants | Belize | 0.0 /100 | #303 | Tragic 2.8% |
| Cree | 0.0 /100 | #304 | Tragic 2.8% |
| Immigrants | West Indies | 0.0 /100 | #305 | Tragic 2.8% |
| Aleuts | 0.0 /100 | #306 | Tragic 2.8% |
| Natives/Alaskans | 0.0 /100 | #307 | Tragic 2.8% |
| Immigrants | Grenada | 0.0 /100 | #308 | Tragic 2.8% |
| Bangladeshis | 0.0 /100 | #309 | Tragic 2.8% |
| British West Indians | 0.0 /100 | #310 | Tragic 2.8% |