Welsh vs Immigrants from Belize Self-Care Disability
COMPARE
Welsh
Immigrants from Belize
Self-Care Disability
Self-Care Disability Comparison
Welsh
Immigrants from Belize
2.5%
SELF-CARE DISABILITY
50.0/ 100
METRIC RATING
174th/ 347
METRIC RANK
2.8%
SELF-CARE DISABILITY
0.0/ 100
METRIC RATING
303rd/ 347
METRIC RANK
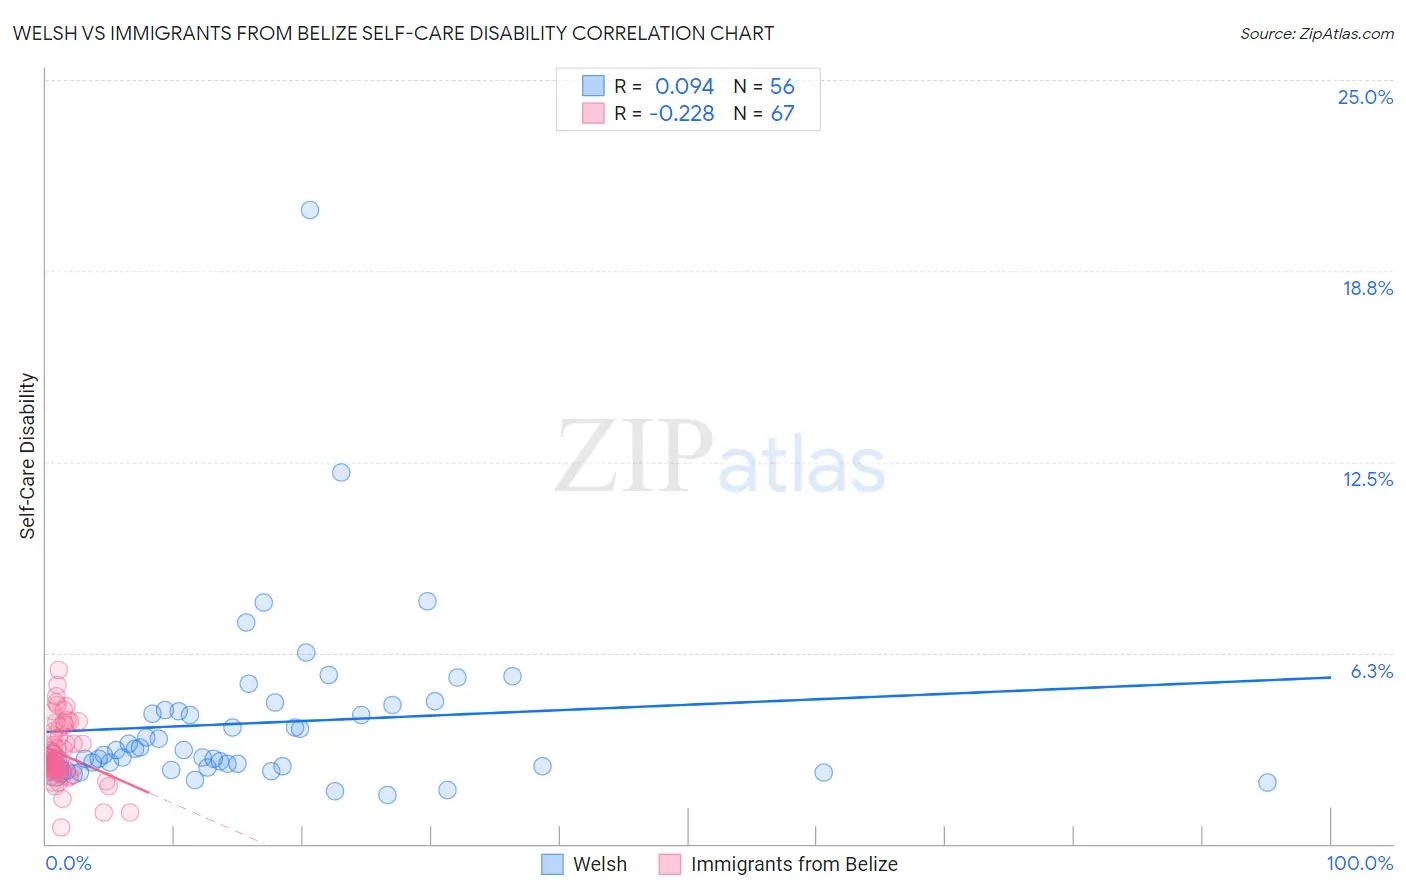
Welsh vs Immigrants from Belize Self-Care Disability Correlation Chart
The statistical analysis conducted on geographies consisting of 527,151,887 people shows a slight positive correlation between the proportion of Welsh and percentage of population with self-care disability in the United States with a correlation coefficient (R) of 0.094 and weighted average of 2.5%. Similarly, the statistical analysis conducted on geographies consisting of 130,238,734 people shows a weak negative correlation between the proportion of Immigrants from Belize and percentage of population with self-care disability in the United States with a correlation coefficient (R) of -0.228 and weighted average of 2.8%, a difference of 13.0%.
Self-Care Disability Correlation Summary
| Measurement | Welsh | Immigrants from Belize |
| Minimum | 1.6% | 0.53% |
| Maximum | 20.7% | 5.7% |
| Range | 19.1% | 5.2% |
| Mean | 4.0% | 2.9% |
| Median | 3.0% | 2.7% |
| Interquartile 25% (IQ1) | 2.5% | 2.4% |
| Interquartile 75% (IQ3) | 4.4% | 3.6% |
| Interquartile Range (IQR) | 1.8% | 1.1% |
| Standard Deviation (Sample) | 2.9% | 0.98% |
| Standard Deviation (Population) | 2.9% | 0.97% |
Similar Demographics by Self-Care Disability
Demographics Similar to Welsh by Self-Care Disability
In terms of self-care disability, the demographic groups most similar to Welsh are Immigrants from Bosnia and Herzegovina (2.5%, a difference of 0.020%), Immigrants from Afghanistan (2.5%, a difference of 0.11%), Immigrants from Burma/Myanmar (2.5%, a difference of 0.13%), Immigrants from Kazakhstan (2.5%, a difference of 0.16%), and Pennsylvania German (2.5%, a difference of 0.17%).
| Demographics | Rating | Rank | Self-Care Disability |
| Immigrants | Greece | 57.3 /100 | #167 | Average 2.5% |
| Ute | 57.1 /100 | #168 | Average 2.5% |
| Immigrants | Somalia | 55.9 /100 | #169 | Average 2.5% |
| Scottish | 54.3 /100 | #170 | Average 2.5% |
| Pennsylvania Germans | 53.5 /100 | #171 | Average 2.5% |
| Czechoslovakians | 53.5 /100 | #172 | Average 2.5% |
| Immigrants | Burma/Myanmar | 52.8 /100 | #173 | Average 2.5% |
| Welsh | 50.0 /100 | #174 | Average 2.5% |
| Immigrants | Bosnia and Herzegovina | 49.6 /100 | #175 | Average 2.5% |
| Immigrants | Afghanistan | 47.6 /100 | #176 | Average 2.5% |
| Immigrants | Kazakhstan | 46.7 /100 | #177 | Average 2.5% |
| English | 46.2 /100 | #178 | Average 2.5% |
| Hungarians | 45.5 /100 | #179 | Average 2.5% |
| Indonesians | 41.2 /100 | #180 | Average 2.5% |
| Ghanaians | 40.4 /100 | #181 | Average 2.5% |
Demographics Similar to Immigrants from Belize by Self-Care Disability
In terms of self-care disability, the demographic groups most similar to Immigrants from Belize are Immigrants from St. Vincent and the Grenadines (2.8%, a difference of 0.15%), Cree (2.8%, a difference of 0.16%), Pima (2.8%, a difference of 0.18%), Immigrants from West Indies (2.8%, a difference of 0.20%), and Immigrants from Fiji (2.8%, a difference of 0.28%).
| Demographics | Rating | Rank | Self-Care Disability |
| Immigrants | Portugal | 0.0 /100 | #296 | Tragic 2.8% |
| West Indians | 0.0 /100 | #297 | Tragic 2.8% |
| Americans | 0.0 /100 | #298 | Tragic 2.8% |
| Immigrants | Guyana | 0.0 /100 | #299 | Tragic 2.8% |
| Immigrants | Fiji | 0.0 /100 | #300 | Tragic 2.8% |
| Pima | 0.0 /100 | #301 | Tragic 2.8% |
| Immigrants | St. Vincent and the Grenadines | 0.0 /100 | #302 | Tragic 2.8% |
| Immigrants | Belize | 0.0 /100 | #303 | Tragic 2.8% |
| Cree | 0.0 /100 | #304 | Tragic 2.8% |
| Immigrants | West Indies | 0.0 /100 | #305 | Tragic 2.8% |
| Aleuts | 0.0 /100 | #306 | Tragic 2.8% |
| Natives/Alaskans | 0.0 /100 | #307 | Tragic 2.8% |
| Immigrants | Grenada | 0.0 /100 | #308 | Tragic 2.8% |
| Bangladeshis | 0.0 /100 | #309 | Tragic 2.8% |
| British West Indians | 0.0 /100 | #310 | Tragic 2.8% |