Icelander vs Immigrants from Belize Self-Care Disability
COMPARE
Icelander
Immigrants from Belize
Self-Care Disability
Self-Care Disability Comparison
Icelanders
Immigrants from Belize
2.4%
SELF-CARE DISABILITY
97.4/ 100
METRIC RATING
92nd/ 347
METRIC RANK
2.8%
SELF-CARE DISABILITY
0.0/ 100
METRIC RATING
303rd/ 347
METRIC RANK
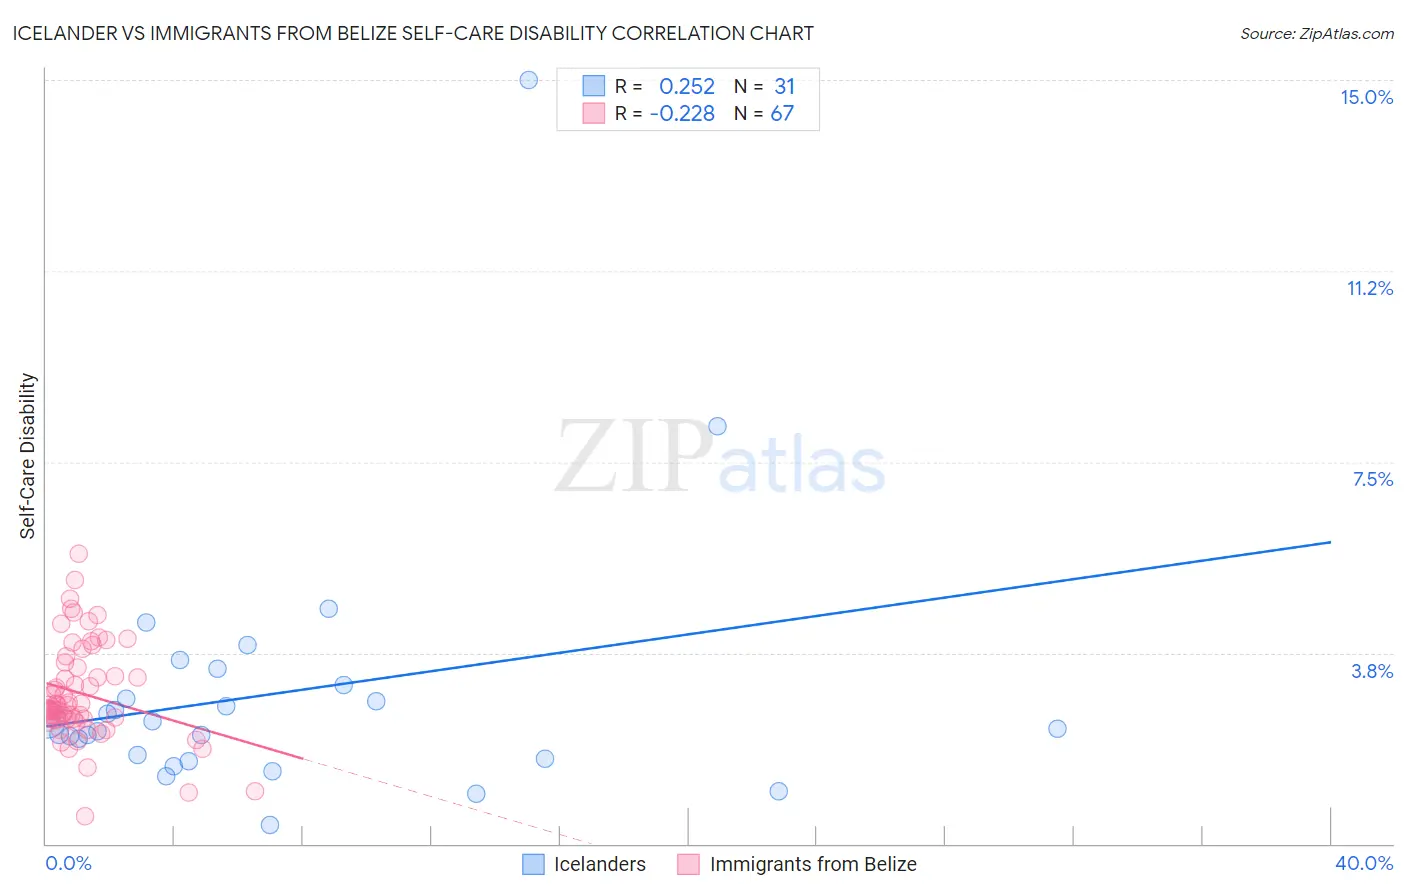
Icelander vs Immigrants from Belize Self-Care Disability Correlation Chart
The statistical analysis conducted on geographies consisting of 159,567,572 people shows a weak positive correlation between the proportion of Icelanders and percentage of population with self-care disability in the United States with a correlation coefficient (R) of 0.252 and weighted average of 2.4%. Similarly, the statistical analysis conducted on geographies consisting of 130,238,734 people shows a weak negative correlation between the proportion of Immigrants from Belize and percentage of population with self-care disability in the United States with a correlation coefficient (R) of -0.228 and weighted average of 2.8%, a difference of 18.1%.
Self-Care Disability Correlation Summary
| Measurement | Icelander | Immigrants from Belize |
| Minimum | 0.38% | 0.53% |
| Maximum | 15.0% | 5.7% |
| Range | 14.6% | 5.2% |
| Mean | 2.9% | 2.9% |
| Median | 2.3% | 2.7% |
| Interquartile 25% (IQ1) | 1.7% | 2.4% |
| Interquartile 75% (IQ3) | 3.1% | 3.6% |
| Interquartile Range (IQR) | 1.4% | 1.1% |
| Standard Deviation (Sample) | 2.6% | 0.98% |
| Standard Deviation (Population) | 2.6% | 0.97% |
Similar Demographics by Self-Care Disability
Demographics Similar to Icelanders by Self-Care Disability
In terms of self-care disability, the demographic groups most similar to Icelanders are Immigrants from Jordan (2.4%, a difference of 0.14%), Immigrants from Czechoslovakia (2.4%, a difference of 0.15%), Immigrants from Latvia (2.4%, a difference of 0.19%), Macedonian (2.4%, a difference of 0.24%), and Immigrants from Asia (2.4%, a difference of 0.25%).
| Demographics | Rating | Rank | Self-Care Disability |
| Estonians | 98.3 /100 | #85 | Exceptional 2.3% |
| Immigrants | Northern Africa | 98.2 /100 | #86 | Exceptional 2.3% |
| Sierra Leoneans | 98.0 /100 | #87 | Exceptional 2.4% |
| Lithuanians | 98.0 /100 | #88 | Exceptional 2.4% |
| Immigrants | Congo | 98.0 /100 | #89 | Exceptional 2.4% |
| Immigrants | Czechoslovakia | 97.7 /100 | #90 | Exceptional 2.4% |
| Immigrants | Jordan | 97.7 /100 | #91 | Exceptional 2.4% |
| Icelanders | 97.4 /100 | #92 | Exceptional 2.4% |
| Immigrants | Latvia | 97.0 /100 | #93 | Exceptional 2.4% |
| Macedonians | 96.9 /100 | #94 | Exceptional 2.4% |
| Immigrants | Asia | 96.9 /100 | #95 | Exceptional 2.4% |
| Immigrants | Chile | 96.7 /100 | #96 | Exceptional 2.4% |
| Swiss | 96.6 /100 | #97 | Exceptional 2.4% |
| Immigrants | Poland | 96.4 /100 | #98 | Exceptional 2.4% |
| Immigrants | Israel | 96.1 /100 | #99 | Exceptional 2.4% |
Demographics Similar to Immigrants from Belize by Self-Care Disability
In terms of self-care disability, the demographic groups most similar to Immigrants from Belize are Immigrants from St. Vincent and the Grenadines (2.8%, a difference of 0.15%), Cree (2.8%, a difference of 0.16%), Pima (2.8%, a difference of 0.18%), Immigrants from West Indies (2.8%, a difference of 0.20%), and Immigrants from Fiji (2.8%, a difference of 0.28%).
| Demographics | Rating | Rank | Self-Care Disability |
| Immigrants | Portugal | 0.0 /100 | #296 | Tragic 2.8% |
| West Indians | 0.0 /100 | #297 | Tragic 2.8% |
| Americans | 0.0 /100 | #298 | Tragic 2.8% |
| Immigrants | Guyana | 0.0 /100 | #299 | Tragic 2.8% |
| Immigrants | Fiji | 0.0 /100 | #300 | Tragic 2.8% |
| Pima | 0.0 /100 | #301 | Tragic 2.8% |
| Immigrants | St. Vincent and the Grenadines | 0.0 /100 | #302 | Tragic 2.8% |
| Immigrants | Belize | 0.0 /100 | #303 | Tragic 2.8% |
| Cree | 0.0 /100 | #304 | Tragic 2.8% |
| Immigrants | West Indies | 0.0 /100 | #305 | Tragic 2.8% |
| Aleuts | 0.0 /100 | #306 | Tragic 2.8% |
| Natives/Alaskans | 0.0 /100 | #307 | Tragic 2.8% |
| Immigrants | Grenada | 0.0 /100 | #308 | Tragic 2.8% |
| Bangladeshis | 0.0 /100 | #309 | Tragic 2.8% |
| British West Indians | 0.0 /100 | #310 | Tragic 2.8% |