Osage vs Immigrants from Belize 2nd Grade

COMPARE

Osage
Race
Ancestry
AfghanAfricanAlaska NativeAlaskan AthabascanAlbanianAleutAlsatianAmericanApacheArabArapahoArgentineanArmenianAssyrian/Chaldean/SyriacAustralianAustrianBahamianBangladeshiBarbadianBasqueBelgianBelizeanBermudanBhutaneseBlackfeetBolivianBrazilianBritishBritish West IndianBulgarianBurmeseCajunCambodianCanadianCape VerdeanCarpatho RusynCelticCentral AmericanCentral American IndianCherokeeCheyenneChickasawChileanChineseChippewaChoctawColombianColvilleComancheCosta RicanCreeCreekCroatianCrowCubanCypriotCzechCzechoslovakianDanishDelawareDominicanDutchDutch West IndianEastern EuropeanEcuadorianEgyptianEnglishEstonianEthiopianEuropeanFijianFilipinoFinnishFrenchFrench American IndianFrench CanadianGermanGerman RussianGhanaianGreekGuamanian/ChamorroGuatemalanGuyaneseHaitianHmongHonduranHopiHoumaHungarianIcelanderIndian (Asian)IndonesianInupiatIranianIraqiIrishIroquoisIsraeliItalianJamaicanJapaneseJordanianKenyanKiowaKoreanLaotianLatvianLebaneseLiberianLithuanianLumbeeLuxembourgerMacedonianMalaysianMalteseMarshalleseMenomineeMexicanMexican American IndianMongolianMoroccanNative HawaiianNavajoNepaleseNew ZealanderNicaraguanNigerianNorthern EuropeanNorwegianOkinawanOsageOttawaPaiutePakistaniPalestinianPanamanianParaguayanPennsylvania GermanPeruvianPimaPolishPortuguesePotawatomiPuebloPuerto RicanPuget Sound SalishRomanianRussianSalvadoranSamoanScandinavianScotch-IrishScottishSeminoleSenegaleseSerbianShoshoneSierra LeoneanSiouxSlavicSlovakSloveneSomaliSouth AfricanSouth AmericanSouth American IndianSoviet UnionSpaniardSpanishSpanish AmericanSpanish American IndianSri LankanSubsaharan AfricanSudaneseSwedishSwissSyrianTaiwaneseThaiTlingit-HaidaTohono O'OdhamTonganTrinidadian and TobagonianTsimshianTurkishU.S. Virgin IslanderUgandanUkrainianUruguayanUteVenezuelanVietnameseWelshWest IndianYakamaYaquiYugoslavianYumanYup'ikZimbabwean
Immigration
NonimmigrantsImmigrantsAfghanistanAfricaAlbaniaArgentinaArmeniaAsiaAustraliaAustriaBahamasBangladeshBarbadosBelarusBelgiumBoliviaBosnia and HerzegovinaBrazilBulgariaBurma/MyanmarCabo VerdeCambodiaCameroonCanadaCaribbeanCentral AmericaChileChinaColombiaCongoCosta RicaCroatiaCubaCzechoslovakiaDenmarkDominicaDominican RepublicEastern AfricaEastern AsiaEastern EuropeEcuadorEgyptEl SalvadorEnglandEritreaEthiopiaEuropeFijiFranceGermanyGhanaGreeceGrenadaGuatemalaGuyanaHaitiHondurasHong KongHungaryIndiaIndonesiaIranIraqIrelandIsraelItalyJamaicaJapanJordanKazakhstanKenyaKoreaKuwaitLaosLatin AmericaLatviaLebanonLiberiaLithuaniaMalaysiaMexicoMicronesiaMiddle AfricaMoldovaMoroccoNepalNetherlandsNicaraguaNigeriaNorth AmericaNorth MacedoniaNorthern AfricaNorthern EuropeNorwayOceaniaPakistanPanamaPeruPhilippinesPolandPortugalRomaniaRussiaSaudi ArabiaScotlandSenegalSerbiaSierra LeoneSingaporeSomaliaSouth AfricaSouth AmericaSouth Central AsiaSouth Eastern AsiaSouthern EuropeSpainSri LankaSt. Vincent and the GrenadinesSudanSwedenSwitzerlandSyriaTaiwanThailandTrinidad and TobagoTurkeyUgandaUkraineUruguayUzbekistanVenezuelaVietnamWest IndiesWestern AfricaWestern AsiaWestern EuropeYemenZaireZimbabweAzores
Immigrants from Belize
Race
Ancestry
AfghanAfricanAlaska NativeAlaskan AthabascanAlbanianAleutAlsatianAmericanApacheArabArapahoArgentineanArmenianAssyrian/Chaldean/SyriacAustralianAustrianBahamianBangladeshiBarbadianBasqueBelgianBelizeanBermudanBhutaneseBlackfeetBolivianBrazilianBritishBritish West IndianBulgarianBurmeseCajunCambodianCanadianCape VerdeanCarpatho RusynCelticCentral AmericanCentral American IndianCherokeeCheyenneChickasawChileanChineseChippewaChoctawColombianColvilleComancheCosta RicanCreeCreekCroatianCrowCubanCypriotCzechCzechoslovakianDanishDelawareDominicanDutchDutch West IndianEastern EuropeanEcuadorianEgyptianEnglishEstonianEthiopianEuropeanFijianFilipinoFinnishFrenchFrench American IndianFrench CanadianGermanGerman RussianGhanaianGreekGuamanian/ChamorroGuatemalanGuyaneseHaitianHmongHonduranHopiHoumaHungarianIcelanderIndian (Asian)IndonesianInupiatIranianIraqiIrishIroquoisIsraeliItalianJamaicanJapaneseJordanianKenyanKiowaKoreanLaotianLatvianLebaneseLiberianLithuanianLumbeeLuxembourgerMacedonianMalaysianMalteseMarshalleseMenomineeMexicanMexican American IndianMongolianMoroccanNative HawaiianNavajoNepaleseNew ZealanderNicaraguanNigerianNorthern EuropeanNorwegianOkinawanOttawaPaiutePakistaniPalestinianPanamanianParaguayanPennsylvania GermanPeruvianPimaPolishPortuguesePotawatomiPuebloPuerto RicanPuget Sound SalishRomanianRussianSalvadoranSamoanScandinavianScotch-IrishScottishSeminoleSenegaleseSerbianShoshoneSierra LeoneanSiouxSlavicSlovakSloveneSomaliSouth AfricanSouth AmericanSouth American IndianSoviet UnionSpaniardSpanishSpanish AmericanSpanish American IndianSri LankanSubsaharan AfricanSudaneseSwedishSwissSyrianTaiwaneseThaiTlingit-HaidaTohono O'OdhamTonganTrinidadian and TobagonianTsimshianTurkishU.S. Virgin IslanderUgandanUkrainianUruguayanUteVenezuelanVietnameseWelshWest IndianYakamaYaquiYugoslavianYumanYup'ikZimbabwean
Immigration
NonimmigrantsImmigrantsAfghanistanAfricaAlbaniaArgentinaArmeniaAsiaAustraliaAustriaBahamasBangladeshBarbadosBelarusBelgiumBelizeBoliviaBosnia and HerzegovinaBrazilBulgariaBurma/MyanmarCabo VerdeCambodiaCameroonCanadaCaribbeanCentral AmericaChileChinaColombiaCongoCosta RicaCroatiaCubaCzechoslovakiaDenmarkDominicaDominican RepublicEastern AfricaEastern AsiaEastern EuropeEcuadorEgyptEl SalvadorEnglandEritreaEthiopiaEuropeFijiFranceGermanyGhanaGreeceGrenadaGuatemalaGuyanaHaitiHondurasHong KongHungaryIndiaIndonesiaIranIraqIrelandIsraelItalyJamaicaJapanJordanKazakhstanKenyaKoreaKuwaitLaosLatin AmericaLatviaLebanonLiberiaLithuaniaMalaysiaMexicoMicronesiaMiddle AfricaMoldovaMoroccoNepalNetherlandsNicaraguaNigeriaNorth AmericaNorth MacedoniaNorthern AfricaNorthern EuropeNorwayOceaniaPakistanPanamaPeruPhilippinesPolandPortugalRomaniaRussiaSaudi ArabiaScotlandSenegalSerbiaSierra LeoneSingaporeSomaliaSouth AfricaSouth AmericaSouth Central AsiaSouth Eastern AsiaSouthern EuropeSpainSri LankaSt. Vincent and the GrenadinesSudanSwedenSwitzerlandSyriaTaiwanThailandTrinidad and TobagoTurkeyUgandaUkraineUruguayUzbekistanVenezuelaVietnamWest IndiesWestern AfricaWestern AsiaWestern EuropeYemenZaireZimbabweAzores
2nd Grade
Income
Poverty
Unemployment
Labor Participation
Family Structure
Vehicle Availability
Education Level
Disability

2nd Grade Comparison

Osage

Immigrants from Belize

Exceptional
Tragic
98.2%
2ND GRADE
99.2/ 100
METRIC RATING
80th/ 347
METRIC RANK
96.8%
2ND GRADE
0.0/ 100
METRIC RATING
315th/ 347
METRIC RANK

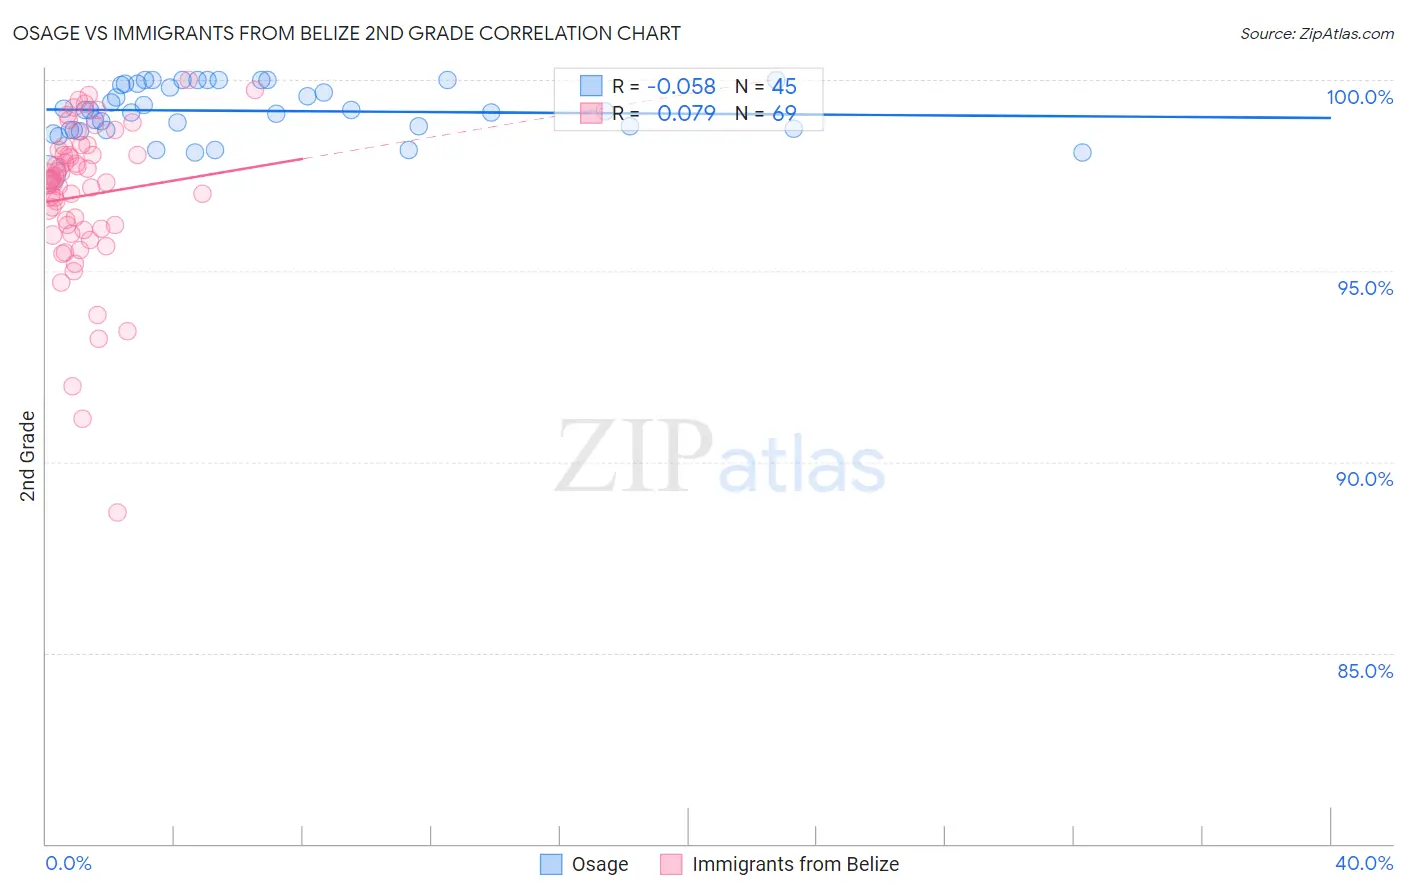
Osage vs Immigrants from Belize 2nd Grade Correlation Chart

The statistical analysis conducted on geographies consisting of 91,808,929 people shows a slight negative correlation between the proportion of Osage and percentage of population with at least 2nd grade education in the United States with a correlation coefficient (R) of -0.058 and weighted average of 98.2%. Similarly, the statistical analysis conducted on geographies consisting of 130,328,311 people shows a slight positive correlation between the proportion of Immigrants from Belize and percentage of population with at least 2nd grade education in the United States with a correlation coefficient (R) of 0.079 and weighted average of 96.8%, a difference of 1.5%.
Osage vs Immigrants from Belize 2nd Grade

2nd Grade Correlation Summary

MeasurementOsageImmigrants from Belize
Minimum97.5%88.7%
Maximum100.0%100.0%
Range2.5%11.3%
Mean99.2%97.0%
Median99.2%97.4%
Interquartile 25% (IQ1)98.7%96.1%
Interquartile 75% (IQ3)99.9%98.1%
Interquartile Range (IQR)1.2%2.0%
Standard Deviation (Sample)0.67%2.0%
Standard Deviation (Population)0.66%2.0%

Similar Demographics by 2nd Grade

Demographics Similar to Osage by 2nd Grade

In terms of 2nd grade, the demographic groups most similar to Osage are Immigrants from Lithuania (98.2%, a difference of 0.0%), Immigrants from Belgium (98.2%, a difference of 0.0%), Shoshone (98.3%, a difference of 0.010%), Cherokee (98.3%, a difference of 0.010%), and Immigrants from England (98.3%, a difference of 0.010%).
DemographicsRating | Rank2nd Grade
Cajuns
99.5
/100
|
#73
Exceptional
98.3%
Immigrants | Netherlands
99.4
/100
|
#74
Exceptional
98.3%
Shoshone
99.4
/100
|
#75
Exceptional
98.3%
Cherokee
99.4
/100
|
#76
Exceptional
98.3%
Immigrants | England
99.4
/100
|
#77
Exceptional
98.3%
Immigrants | Lithuania
99.3
/100
|
#78
Exceptional
98.2%
Immigrants | Belgium
99.3
/100
|
#79
Exceptional
98.2%
Osage
99.2
/100
|
#80
Exceptional
98.2%
Icelanders
99.2
/100
|
#81
Exceptional
98.2%
Delaware
99.1
/100
|
#82
Exceptional
98.2%
Immigrants | Sweden
99.1
/100
|
#83
Exceptional
98.2%
Hopi
99.1
/100
|
#84
Exceptional
98.2%
Potawatomi
99.1
/100
|
#85
Exceptional
98.2%
Immigrants | Australia
99.0
/100
|
#86
Exceptional
98.2%
Immigrants | Denmark
99.0
/100
|
#87
Exceptional
98.2%

Demographics Similar to Immigrants from Belize by 2nd Grade

In terms of 2nd grade, the demographic groups most similar to Immigrants from Belize are Honduran (96.7%, a difference of 0.010%), Immigrants from Laos (96.7%, a difference of 0.010%), Indonesian (96.7%, a difference of 0.010%), Immigrants from Nicaragua (96.7%, a difference of 0.010%), and Immigrants from Ecuador (96.8%, a difference of 0.020%).
DemographicsRating | Rank2nd Grade
Immigrants | Haiti
0.0
/100
|
#308
Tragic
96.8%
Belizeans
0.0
/100
|
#309
Tragic
96.8%
Sri Lankans
0.0
/100
|
#310
Tragic
96.8%
Guyanese
0.0
/100
|
#311
Tragic
96.8%
Cape Verdeans
0.0
/100
|
#312
Tragic
96.8%
Hispanics or Latinos
0.0
/100
|
#313
Tragic
96.8%
Immigrants | Ecuador
0.0
/100
|
#314
Tragic
96.8%
Immigrants | Belize
0.0
/100
|
#315
Tragic
96.8%
Hondurans
0.0
/100
|
#316
Tragic
96.7%
Immigrants | Laos
0.0
/100
|
#317
Tragic
96.7%
Indonesians
0.0
/100
|
#318
Tragic
96.7%
Immigrants | Nicaragua
0.0
/100
|
#319
Tragic
96.7%
Immigrants | Guyana
0.0
/100
|
#320
Tragic
96.7%
Immigrants | Burma/Myanmar
0.0
/100
|
#321
Tragic
96.7%
Immigrants | Bangladesh
0.0
/100
|
#322
Tragic
96.7%