Osage vs Immigrants from Nepal Self-Care Disability
COMPARE
Osage
Immigrants from Nepal
Self-Care Disability
Self-Care Disability Comparison
Osage
Immigrants from Nepal
2.6%
SELF-CARE DISABILITY
3.6/ 100
METRIC RATING
224th/ 347
METRIC RANK
2.2%
SELF-CARE DISABILITY
100.0/ 100
METRIC RATING
9th/ 347
METRIC RANK
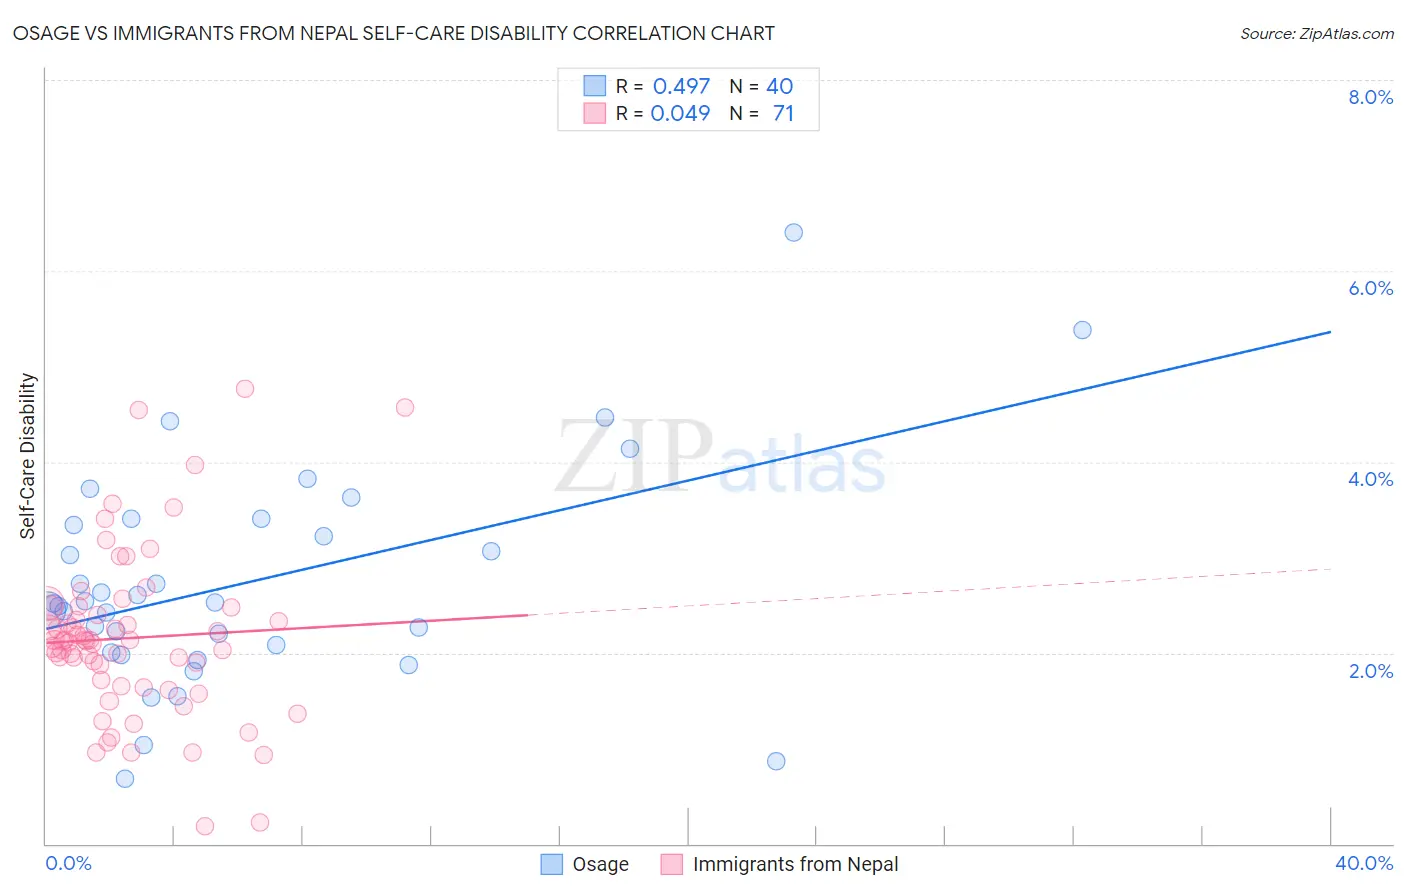
Osage vs Immigrants from Nepal Self-Care Disability Correlation Chart
The statistical analysis conducted on geographies consisting of 91,779,212 people shows a moderate positive correlation between the proportion of Osage and percentage of population with self-care disability in the United States with a correlation coefficient (R) of 0.497 and weighted average of 2.6%. Similarly, the statistical analysis conducted on geographies consisting of 186,625,467 people shows no correlation between the proportion of Immigrants from Nepal and percentage of population with self-care disability in the United States with a correlation coefficient (R) of 0.049 and weighted average of 2.2%, a difference of 18.4%.
Self-Care Disability Correlation Summary
| Measurement | Osage | Immigrants from Nepal |
| Minimum | 0.68% | 0.19% |
| Maximum | 6.4% | 4.8% |
| Range | 5.7% | 4.6% |
| Mean | 2.7% | 2.2% |
| Median | 2.5% | 2.1% |
| Interquartile 25% (IQ1) | 2.0% | 1.7% |
| Interquartile 75% (IQ3) | 3.4% | 2.5% |
| Interquartile Range (IQR) | 1.3% | 0.82% |
| Standard Deviation (Sample) | 1.2% | 0.87% |
| Standard Deviation (Population) | 1.1% | 0.87% |
Similar Demographics by Self-Care Disability
Demographics Similar to Osage by Self-Care Disability
In terms of self-care disability, the demographic groups most similar to Osage are French Canadian (2.6%, a difference of 0.050%), Spaniard (2.6%, a difference of 0.060%), Honduran (2.6%, a difference of 0.070%), Subsaharan African (2.6%, a difference of 0.11%), and Immigrants from Moldova (2.6%, a difference of 0.12%).
| Demographics | Rating | Rank | Self-Care Disability |
| Celtics | 4.4 /100 | #217 | Tragic 2.6% |
| Scotch-Irish | 4.1 /100 | #218 | Tragic 2.6% |
| Immigrants | Moldova | 4.0 /100 | #219 | Tragic 2.6% |
| Sub-Saharan Africans | 4.0 /100 | #220 | Tragic 2.6% |
| Hondurans | 3.8 /100 | #221 | Tragic 2.6% |
| Spaniards | 3.8 /100 | #222 | Tragic 2.6% |
| French Canadians | 3.8 /100 | #223 | Tragic 2.6% |
| Osage | 3.6 /100 | #224 | Tragic 2.6% |
| Iraqis | 3.2 /100 | #225 | Tragic 2.6% |
| Chinese | 2.9 /100 | #226 | Tragic 2.6% |
| Immigrants | Philippines | 2.7 /100 | #227 | Tragic 2.6% |
| Guatemalans | 2.7 /100 | #228 | Tragic 2.6% |
| Guamanians/Chamorros | 2.5 /100 | #229 | Tragic 2.6% |
| Immigrants | Ecuador | 2.5 /100 | #230 | Tragic 2.6% |
| Immigrants | Guatemala | 2.2 /100 | #231 | Tragic 2.6% |
Demographics Similar to Immigrants from Nepal by Self-Care Disability
In terms of self-care disability, the demographic groups most similar to Immigrants from Nepal are Bolivian (2.2%, a difference of 0.14%), Immigrants from Bolivia (2.2%, a difference of 0.18%), Filipino (2.2%, a difference of 0.39%), Zimbabwean (2.2%, a difference of 0.64%), and Sudanese (2.2%, a difference of 1.2%).
| Demographics | Rating | Rank | Self-Care Disability |
| Immigrants | India | 100.0 /100 | #2 | Exceptional 2.0% |
| Thais | 100.0 /100 | #3 | Exceptional 2.1% |
| Immigrants | Singapore | 100.0 /100 | #4 | Exceptional 2.1% |
| Zimbabweans | 100.0 /100 | #5 | Exceptional 2.2% |
| Filipinos | 100.0 /100 | #6 | Exceptional 2.2% |
| Immigrants | Bolivia | 100.0 /100 | #7 | Exceptional 2.2% |
| Bolivians | 100.0 /100 | #8 | Exceptional 2.2% |
| Immigrants | Nepal | 100.0 /100 | #9 | Exceptional 2.2% |
| Sudanese | 100.0 /100 | #10 | Exceptional 2.2% |
| Immigrants | South Central Asia | 100.0 /100 | #11 | Exceptional 2.2% |
| Immigrants | Ethiopia | 100.0 /100 | #12 | Exceptional 2.2% |
| Ethiopians | 100.0 /100 | #13 | Exceptional 2.2% |
| Luxembourgers | 100.0 /100 | #14 | Exceptional 2.2% |
| Okinawans | 100.0 /100 | #15 | Exceptional 2.2% |
| Immigrants | Kuwait | 100.0 /100 | #16 | Exceptional 2.2% |