Immigrants from El Salvador vs Immigrants from Belize Self-Care Disability
COMPARE
Immigrants from El Salvador
Immigrants from Belize
Self-Care Disability
Self-Care Disability Comparison
Immigrants from El Salvador
Immigrants from Belize
2.5%
SELF-CARE DISABILITY
33.0/ 100
METRIC RATING
186th/ 347
METRIC RANK
2.8%
SELF-CARE DISABILITY
0.0/ 100
METRIC RATING
303rd/ 347
METRIC RANK
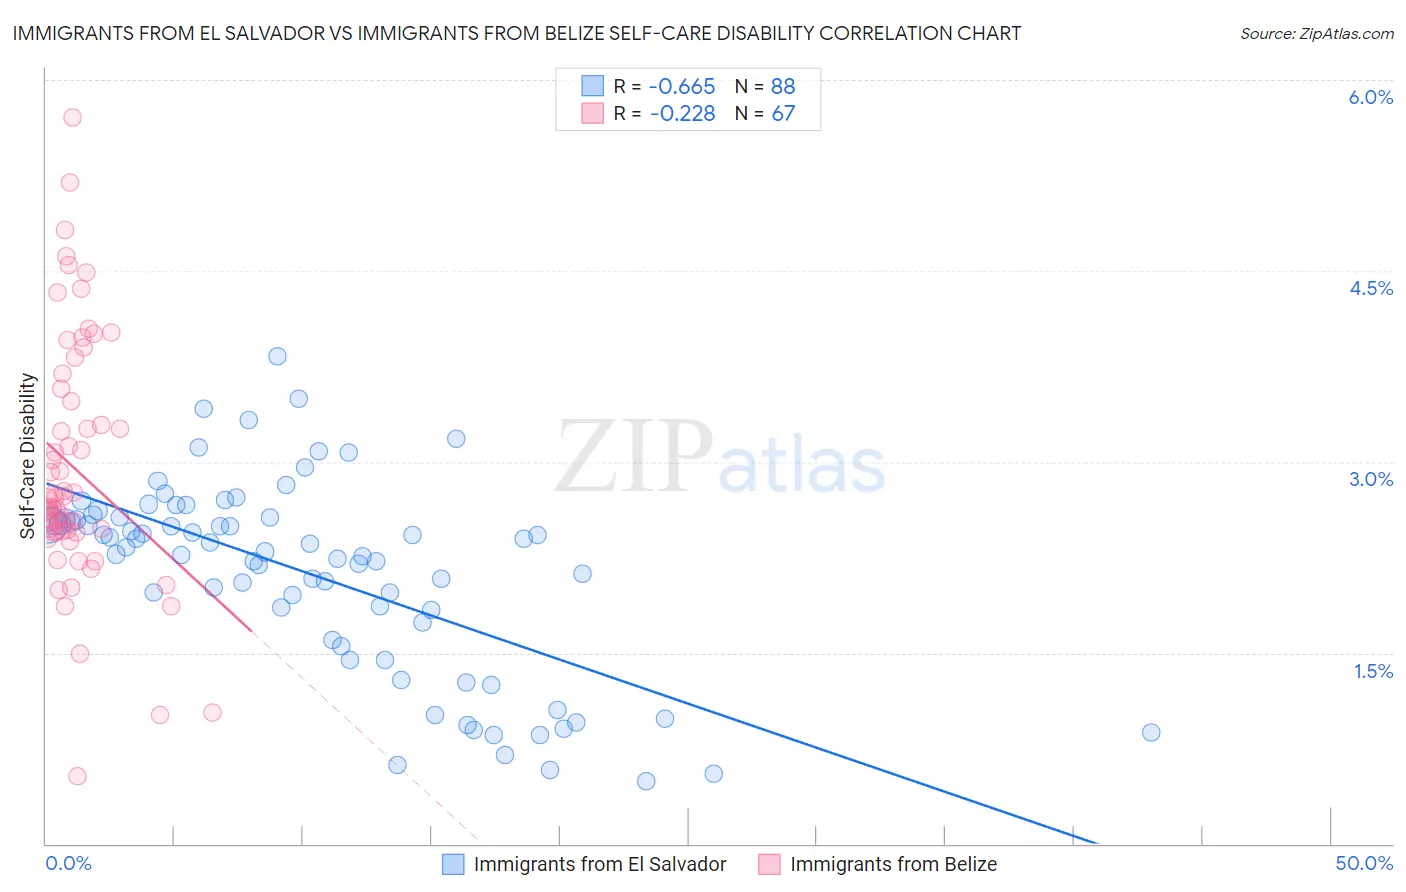
Immigrants from El Salvador vs Immigrants from Belize Self-Care Disability Correlation Chart
The statistical analysis conducted on geographies consisting of 357,509,319 people shows a significant negative correlation between the proportion of Immigrants from El Salvador and percentage of population with self-care disability in the United States with a correlation coefficient (R) of -0.665 and weighted average of 2.5%. Similarly, the statistical analysis conducted on geographies consisting of 130,238,734 people shows a weak negative correlation between the proportion of Immigrants from Belize and percentage of population with self-care disability in the United States with a correlation coefficient (R) of -0.228 and weighted average of 2.8%, a difference of 12.0%.
Self-Care Disability Correlation Summary
| Measurement | Immigrants from El Salvador | Immigrants from Belize |
| Minimum | 0.49% | 0.53% |
| Maximum | 3.8% | 5.7% |
| Range | 3.3% | 5.2% |
| Mean | 2.1% | 2.9% |
| Median | 2.3% | 2.7% |
| Interquartile 25% (IQ1) | 1.7% | 2.4% |
| Interquartile 75% (IQ3) | 2.6% | 3.6% |
| Interquartile Range (IQR) | 0.89% | 1.1% |
| Standard Deviation (Sample) | 0.76% | 0.98% |
| Standard Deviation (Population) | 0.75% | 0.97% |
Similar Demographics by Self-Care Disability
Demographics Similar to Immigrants from El Salvador by Self-Care Disability
In terms of self-care disability, the demographic groups most similar to Immigrants from El Salvador are Slavic (2.5%, a difference of 0.070%), Yugoslavian (2.5%, a difference of 0.17%), Salvadoran (2.5%, a difference of 0.18%), Maltese (2.5%, a difference of 0.23%), and Irish (2.5%, a difference of 0.23%).
| Demographics | Rating | Rank | Self-Care Disability |
| Hungarians | 45.5 /100 | #179 | Average 2.5% |
| Indonesians | 41.2 /100 | #180 | Average 2.5% |
| Ghanaians | 40.4 /100 | #181 | Average 2.5% |
| Maltese | 37.5 /100 | #182 | Fair 2.5% |
| Salvadorans | 36.4 /100 | #183 | Fair 2.5% |
| Yugoslavians | 36.1 /100 | #184 | Fair 2.5% |
| Slavs | 34.3 /100 | #185 | Fair 2.5% |
| Immigrants | El Salvador | 33.0 /100 | #186 | Fair 2.5% |
| Irish | 28.7 /100 | #187 | Fair 2.5% |
| Immigrants | Oceania | 28.3 /100 | #188 | Fair 2.5% |
| Immigrants | Eastern Europe | 28.0 /100 | #189 | Fair 2.5% |
| Sioux | 24.6 /100 | #190 | Fair 2.5% |
| Moroccans | 22.9 /100 | #191 | Fair 2.5% |
| Soviet Union | 22.2 /100 | #192 | Fair 2.5% |
| Ukrainians | 21.4 /100 | #193 | Fair 2.5% |
Demographics Similar to Immigrants from Belize by Self-Care Disability
In terms of self-care disability, the demographic groups most similar to Immigrants from Belize are Immigrants from St. Vincent and the Grenadines (2.8%, a difference of 0.15%), Cree (2.8%, a difference of 0.16%), Pima (2.8%, a difference of 0.18%), Immigrants from West Indies (2.8%, a difference of 0.20%), and Immigrants from Fiji (2.8%, a difference of 0.28%).
| Demographics | Rating | Rank | Self-Care Disability |
| Immigrants | Portugal | 0.0 /100 | #296 | Tragic 2.8% |
| West Indians | 0.0 /100 | #297 | Tragic 2.8% |
| Americans | 0.0 /100 | #298 | Tragic 2.8% |
| Immigrants | Guyana | 0.0 /100 | #299 | Tragic 2.8% |
| Immigrants | Fiji | 0.0 /100 | #300 | Tragic 2.8% |
| Pima | 0.0 /100 | #301 | Tragic 2.8% |
| Immigrants | St. Vincent and the Grenadines | 0.0 /100 | #302 | Tragic 2.8% |
| Immigrants | Belize | 0.0 /100 | #303 | Tragic 2.8% |
| Cree | 0.0 /100 | #304 | Tragic 2.8% |
| Immigrants | West Indies | 0.0 /100 | #305 | Tragic 2.8% |
| Aleuts | 0.0 /100 | #306 | Tragic 2.8% |
| Natives/Alaskans | 0.0 /100 | #307 | Tragic 2.8% |
| Immigrants | Grenada | 0.0 /100 | #308 | Tragic 2.8% |
| Bangladeshis | 0.0 /100 | #309 | Tragic 2.8% |
| British West Indians | 0.0 /100 | #310 | Tragic 2.8% |