Honduran vs Scottish Hearing Disability
COMPARE
Honduran
Scottish
Hearing Disability
Hearing Disability Comparison
Hondurans
Scottish
2.8%
HEARING DISABILITY
93.4/ 100
METRIC RATING
106th/ 347
METRIC RANK
3.7%
HEARING DISABILITY
0.0/ 100
METRIC RATING
300th/ 347
METRIC RANK
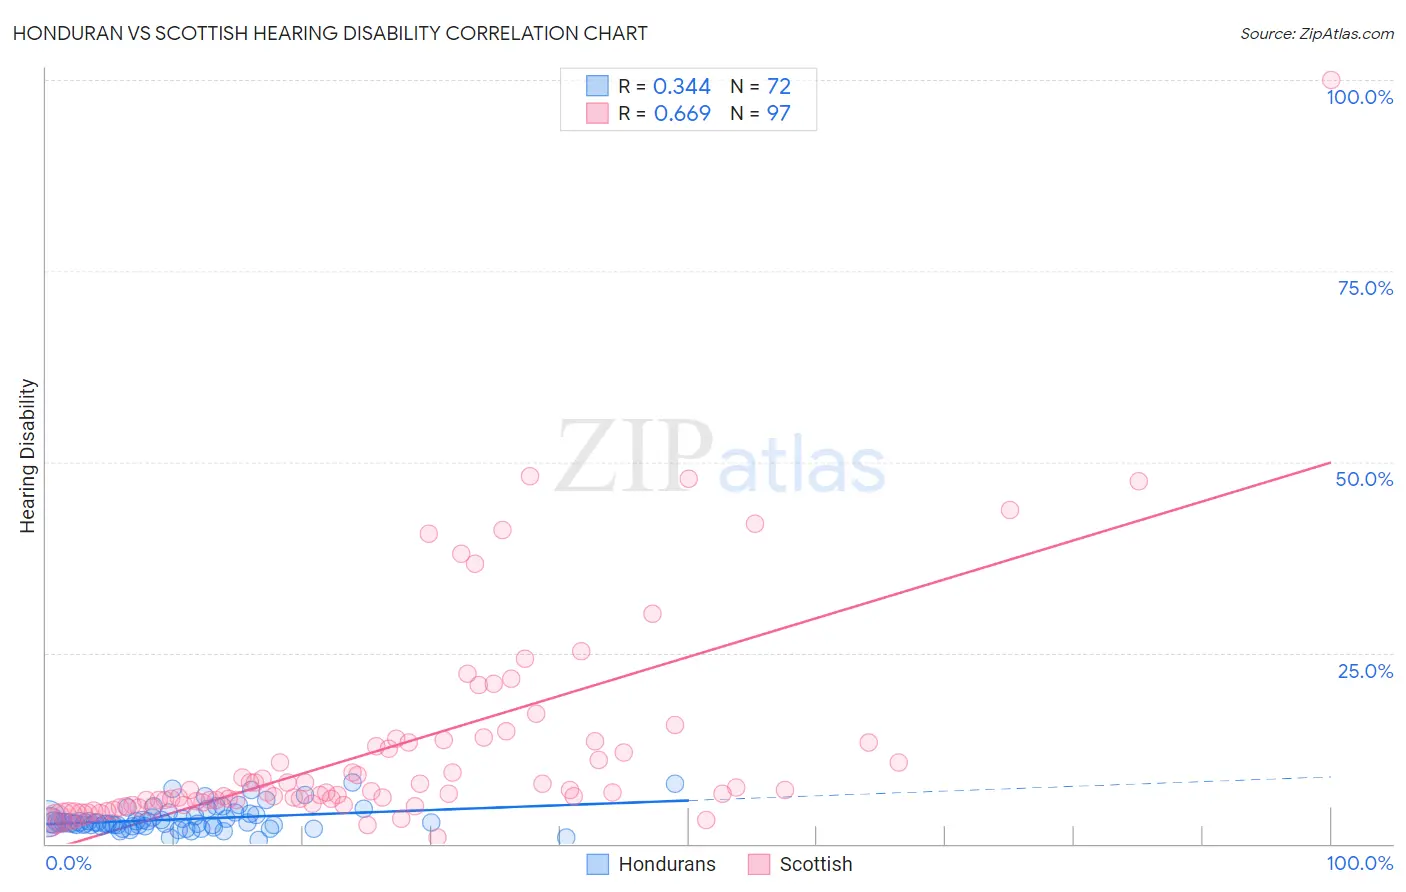
Honduran vs Scottish Hearing Disability Correlation Chart
The statistical analysis conducted on geographies consisting of 357,671,786 people shows a mild positive correlation between the proportion of Hondurans and percentage of population with hearing disability in the United States with a correlation coefficient (R) of 0.344 and weighted average of 2.8%. Similarly, the statistical analysis conducted on geographies consisting of 566,483,062 people shows a significant positive correlation between the proportion of Scottish and percentage of population with hearing disability in the United States with a correlation coefficient (R) of 0.669 and weighted average of 3.7%, a difference of 33.0%.
Hearing Disability Correlation Summary
| Measurement | Honduran | Scottish |
| Minimum | 0.44% | 0.87% |
| Maximum | 8.1% | 100.0% |
| Range | 7.6% | 99.1% |
| Mean | 3.2% | 12.6% |
| Median | 2.8% | 6.8% |
| Interquartile 25% (IQ1) | 2.4% | 5.4% |
| Interquartile 75% (IQ3) | 3.7% | 13.4% |
| Interquartile Range (IQR) | 1.2% | 8.0% |
| Standard Deviation (Sample) | 1.6% | 14.5% |
| Standard Deviation (Population) | 1.5% | 14.4% |
Similar Demographics by Hearing Disability
Demographics Similar to Hondurans by Hearing Disability
In terms of hearing disability, the demographic groups most similar to Hondurans are Immigrants from Chile (2.8%, a difference of 0.0%), Guatemalan (2.8%, a difference of 0.080%), Turkish (2.8%, a difference of 0.15%), Cypriot (2.8%, a difference of 0.20%), and Moroccan (2.8%, a difference of 0.24%).
| Demographics | Rating | Rank | Hearing Disability |
| Immigrants | Guatemala | 95.1 /100 | #99 | Exceptional 2.8% |
| Immigrants | Eastern Africa | 95.0 /100 | #100 | Exceptional 2.8% |
| Immigrants | Spain | 94.9 /100 | #101 | Exceptional 2.8% |
| Taiwanese | 94.8 /100 | #102 | Exceptional 2.8% |
| Immigrants | Indonesia | 94.7 /100 | #103 | Exceptional 2.8% |
| Burmese | 94.2 /100 | #104 | Exceptional 2.8% |
| Moroccans | 93.9 /100 | #105 | Exceptional 2.8% |
| Hondurans | 93.4 /100 | #106 | Exceptional 2.8% |
| Immigrants | Chile | 93.4 /100 | #107 | Exceptional 2.8% |
| Guatemalans | 93.2 /100 | #108 | Exceptional 2.8% |
| Turks | 93.0 /100 | #109 | Exceptional 2.8% |
| Cypriots | 92.9 /100 | #110 | Exceptional 2.8% |
| Immigrants | Yemen | 92.7 /100 | #111 | Exceptional 2.8% |
| U.S. Virgin Islanders | 92.5 /100 | #112 | Exceptional 2.8% |
| Immigrants | Belarus | 91.6 /100 | #113 | Exceptional 2.8% |
Demographics Similar to Scottish by Hearing Disability
In terms of hearing disability, the demographic groups most similar to Scottish are Pennsylvania German (3.7%, a difference of 0.030%), German (3.7%, a difference of 0.060%), Dutch (3.7%, a difference of 0.13%), Menominee (3.7%, a difference of 0.19%), and Celtic (3.7%, a difference of 0.34%).
| Demographics | Rating | Rank | Hearing Disability |
| Norwegians | 0.0 /100 | #293 | Tragic 3.7% |
| Iroquois | 0.0 /100 | #294 | Tragic 3.7% |
| Welsh | 0.0 /100 | #295 | Tragic 3.7% |
| Pima | 0.0 /100 | #296 | Tragic 3.7% |
| Immigrants | Azores | 0.0 /100 | #297 | Tragic 3.7% |
| Celtics | 0.0 /100 | #298 | Tragic 3.7% |
| Germans | 0.0 /100 | #299 | Tragic 3.7% |
| Scottish | 0.0 /100 | #300 | Tragic 3.7% |
| Pennsylvania Germans | 0.0 /100 | #301 | Tragic 3.7% |
| Dutch | 0.0 /100 | #302 | Tragic 3.7% |
| Menominee | 0.0 /100 | #303 | Tragic 3.7% |
| French | 0.0 /100 | #304 | Tragic 3.8% |
| English | 0.0 /100 | #305 | Tragic 3.8% |
| Marshallese | 0.0 /100 | #306 | Tragic 3.8% |
| French Canadians | 0.0 /100 | #307 | Tragic 3.8% |