Hungarian vs Scottish Hearing Disability
COMPARE
Hungarian
Scottish
Hearing Disability
Hearing Disability Comparison
Hungarians
Scottish
3.4%
HEARING DISABILITY
0.4/ 100
METRIC RATING
251st/ 347
METRIC RANK
3.7%
HEARING DISABILITY
0.0/ 100
METRIC RATING
300th/ 347
METRIC RANK
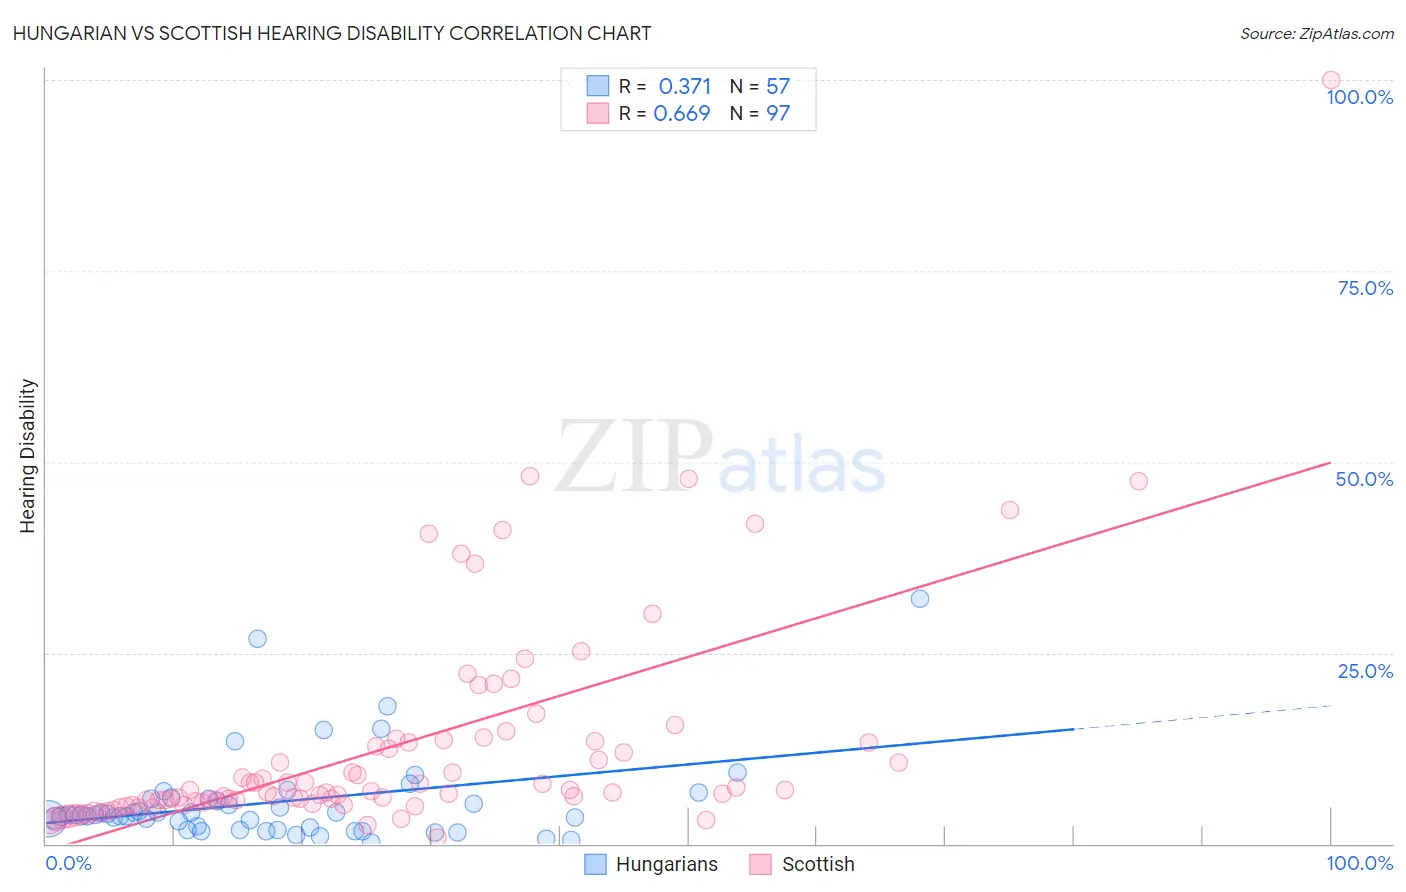
Hungarian vs Scottish Hearing Disability Correlation Chart
The statistical analysis conducted on geographies consisting of 485,961,272 people shows a mild positive correlation between the proportion of Hungarians and percentage of population with hearing disability in the United States with a correlation coefficient (R) of 0.371 and weighted average of 3.4%. Similarly, the statistical analysis conducted on geographies consisting of 566,483,062 people shows a significant positive correlation between the proportion of Scottish and percentage of population with hearing disability in the United States with a correlation coefficient (R) of 0.669 and weighted average of 3.7%, a difference of 10.3%.
Hearing Disability Correlation Summary
| Measurement | Hungarian | Scottish |
| Minimum | 0.091% | 0.87% |
| Maximum | 32.0% | 100.0% |
| Range | 31.9% | 99.1% |
| Mean | 5.4% | 12.6% |
| Median | 3.7% | 6.8% |
| Interquartile 25% (IQ1) | 2.0% | 5.4% |
| Interquartile 75% (IQ3) | 5.9% | 13.4% |
| Interquartile Range (IQR) | 3.9% | 8.0% |
| Standard Deviation (Sample) | 5.9% | 14.5% |
| Standard Deviation (Population) | 5.8% | 14.4% |
Similar Demographics by Hearing Disability
Demographics Similar to Hungarians by Hearing Disability
In terms of hearing disability, the demographic groups most similar to Hungarians are Croatian (3.4%, a difference of 0.21%), Yuman (3.4%, a difference of 0.23%), Italian (3.4%, a difference of 0.24%), Carpatho Rusyn (3.4%, a difference of 0.66%), and Austrian (3.4%, a difference of 0.77%).
| Demographics | Rating | Rank | Hearing Disability |
| Assyrians/Chaldeans/Syriacs | 0.9 /100 | #244 | Tragic 3.3% |
| Immigrants | Scotland | 0.8 /100 | #245 | Tragic 3.3% |
| Immigrants | England | 0.7 /100 | #246 | Tragic 3.3% |
| Lithuanians | 0.6 /100 | #247 | Tragic 3.4% |
| Austrians | 0.6 /100 | #248 | Tragic 3.4% |
| Italians | 0.4 /100 | #249 | Tragic 3.4% |
| Yuman | 0.4 /100 | #250 | Tragic 3.4% |
| Hungarians | 0.4 /100 | #251 | Tragic 3.4% |
| Croatians | 0.4 /100 | #252 | Tragic 3.4% |
| Carpatho Rusyns | 0.3 /100 | #253 | Tragic 3.4% |
| Slavs | 0.2 /100 | #254 | Tragic 3.4% |
| Poles | 0.2 /100 | #255 | Tragic 3.4% |
| Hmong | 0.2 /100 | #256 | Tragic 3.4% |
| Yaqui | 0.2 /100 | #257 | Tragic 3.4% |
| Northern Europeans | 0.2 /100 | #258 | Tragic 3.4% |
Demographics Similar to Scottish by Hearing Disability
In terms of hearing disability, the demographic groups most similar to Scottish are Pennsylvania German (3.7%, a difference of 0.030%), German (3.7%, a difference of 0.060%), Dutch (3.7%, a difference of 0.13%), Menominee (3.7%, a difference of 0.19%), and Celtic (3.7%, a difference of 0.34%).
| Demographics | Rating | Rank | Hearing Disability |
| Norwegians | 0.0 /100 | #293 | Tragic 3.7% |
| Iroquois | 0.0 /100 | #294 | Tragic 3.7% |
| Welsh | 0.0 /100 | #295 | Tragic 3.7% |
| Pima | 0.0 /100 | #296 | Tragic 3.7% |
| Immigrants | Azores | 0.0 /100 | #297 | Tragic 3.7% |
| Celtics | 0.0 /100 | #298 | Tragic 3.7% |
| Germans | 0.0 /100 | #299 | Tragic 3.7% |
| Scottish | 0.0 /100 | #300 | Tragic 3.7% |
| Pennsylvania Germans | 0.0 /100 | #301 | Tragic 3.7% |
| Dutch | 0.0 /100 | #302 | Tragic 3.7% |
| Menominee | 0.0 /100 | #303 | Tragic 3.7% |
| French | 0.0 /100 | #304 | Tragic 3.8% |
| English | 0.0 /100 | #305 | Tragic 3.8% |
| Marshallese | 0.0 /100 | #306 | Tragic 3.8% |
| French Canadians | 0.0 /100 | #307 | Tragic 3.8% |