Arab vs Scottish Hearing Disability
COMPARE
Arab
Scottish
Hearing Disability
Hearing Disability Comparison
Arabs
Scottish
3.0%
HEARING DISABILITY
57.6/ 100
METRIC RATING
169th/ 347
METRIC RANK
3.7%
HEARING DISABILITY
0.0/ 100
METRIC RATING
300th/ 347
METRIC RANK
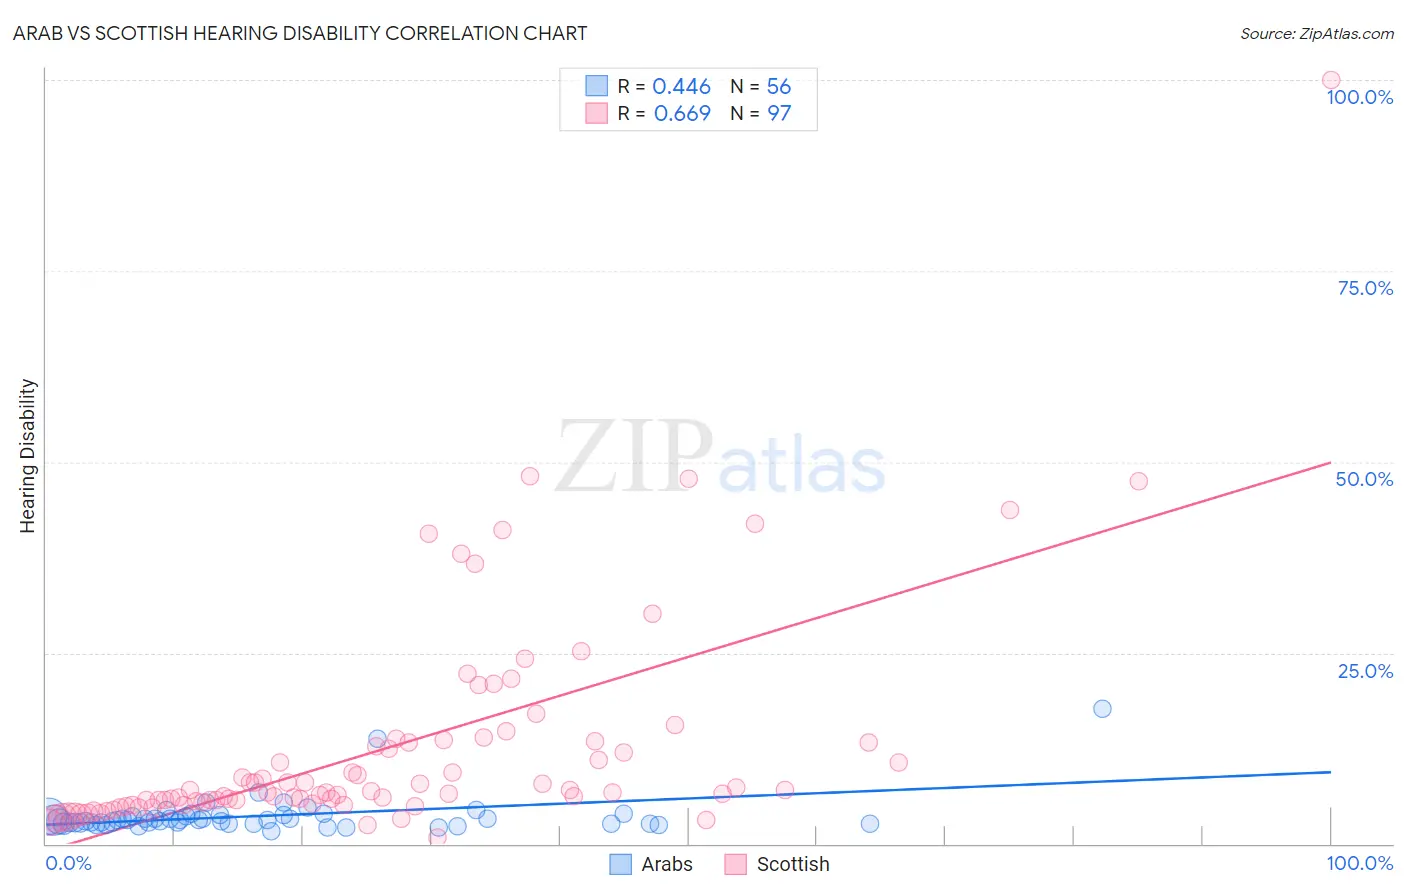
Arab vs Scottish Hearing Disability Correlation Chart
The statistical analysis conducted on geographies consisting of 486,579,834 people shows a moderate positive correlation between the proportion of Arabs and percentage of population with hearing disability in the United States with a correlation coefficient (R) of 0.446 and weighted average of 3.0%. Similarly, the statistical analysis conducted on geographies consisting of 566,483,062 people shows a significant positive correlation between the proportion of Scottish and percentage of population with hearing disability in the United States with a correlation coefficient (R) of 0.669 and weighted average of 3.7%, a difference of 25.6%.
Hearing Disability Correlation Summary
| Measurement | Arab | Scottish |
| Minimum | 1.7% | 0.87% |
| Maximum | 17.8% | 100.0% |
| Range | 16.1% | 99.1% |
| Mean | 3.6% | 12.6% |
| Median | 3.1% | 6.8% |
| Interquartile 25% (IQ1) | 2.7% | 5.4% |
| Interquartile 75% (IQ3) | 3.6% | 13.4% |
| Interquartile Range (IQR) | 0.96% | 8.0% |
| Standard Deviation (Sample) | 2.5% | 14.5% |
| Standard Deviation (Population) | 2.5% | 14.4% |
Similar Demographics by Hearing Disability
Demographics Similar to Arabs by Hearing Disability
In terms of hearing disability, the demographic groups most similar to Arabs are Immigrants from Greece (3.0%, a difference of 0.030%), Immigrants from Eastern Europe (3.0%, a difference of 0.040%), Immigrants from Cabo Verde (3.0%, a difference of 0.070%), Immigrants from Ukraine (3.0%, a difference of 0.10%), and Armenian (3.0%, a difference of 0.15%).
| Demographics | Rating | Rank | Hearing Disability |
| Immigrants | Japan | 66.3 /100 | #162 | Good 2.9% |
| Immigrants | Central America | 64.9 /100 | #163 | Good 3.0% |
| Immigrants | Cambodia | 64.8 /100 | #164 | Good 3.0% |
| Immigrants | Zimbabwe | 64.2 /100 | #165 | Good 3.0% |
| Immigrants | South Eastern Asia | 62.9 /100 | #166 | Good 3.0% |
| Immigrants | Eastern Europe | 58.1 /100 | #167 | Average 3.0% |
| Immigrants | Greece | 57.9 /100 | #168 | Average 3.0% |
| Arabs | 57.6 /100 | #169 | Average 3.0% |
| Immigrants | Cabo Verde | 56.9 /100 | #170 | Average 3.0% |
| Immigrants | Ukraine | 56.6 /100 | #171 | Average 3.0% |
| Armenians | 56.0 /100 | #172 | Average 3.0% |
| Immigrants | Serbia | 51.1 /100 | #173 | Average 3.0% |
| Indonesians | 50.0 /100 | #174 | Average 3.0% |
| Immigrants | Romania | 48.4 /100 | #175 | Average 3.0% |
| Panamanians | 47.0 /100 | #176 | Average 3.0% |
Demographics Similar to Scottish by Hearing Disability
In terms of hearing disability, the demographic groups most similar to Scottish are Pennsylvania German (3.7%, a difference of 0.030%), German (3.7%, a difference of 0.060%), Dutch (3.7%, a difference of 0.13%), Menominee (3.7%, a difference of 0.19%), and Celtic (3.7%, a difference of 0.34%).
| Demographics | Rating | Rank | Hearing Disability |
| Norwegians | 0.0 /100 | #293 | Tragic 3.7% |
| Iroquois | 0.0 /100 | #294 | Tragic 3.7% |
| Welsh | 0.0 /100 | #295 | Tragic 3.7% |
| Pima | 0.0 /100 | #296 | Tragic 3.7% |
| Immigrants | Azores | 0.0 /100 | #297 | Tragic 3.7% |
| Celtics | 0.0 /100 | #298 | Tragic 3.7% |
| Germans | 0.0 /100 | #299 | Tragic 3.7% |
| Scottish | 0.0 /100 | #300 | Tragic 3.7% |
| Pennsylvania Germans | 0.0 /100 | #301 | Tragic 3.7% |
| Dutch | 0.0 /100 | #302 | Tragic 3.7% |
| Menominee | 0.0 /100 | #303 | Tragic 3.7% |
| French | 0.0 /100 | #304 | Tragic 3.8% |
| English | 0.0 /100 | #305 | Tragic 3.8% |
| Marshallese | 0.0 /100 | #306 | Tragic 3.8% |
| French Canadians | 0.0 /100 | #307 | Tragic 3.8% |