Okinawan vs Cheyenne Ambulatory Disability
COMPARE
Okinawan
Cheyenne
Ambulatory Disability
Ambulatory Disability Comparison
Okinawans
Cheyenne
5.3%
AMBULATORY DISABILITY
100.0/ 100
METRIC RATING
12th/ 347
METRIC RANK
6.9%
AMBULATORY DISABILITY
0.0/ 100
METRIC RATING
292nd/ 347
METRIC RANK
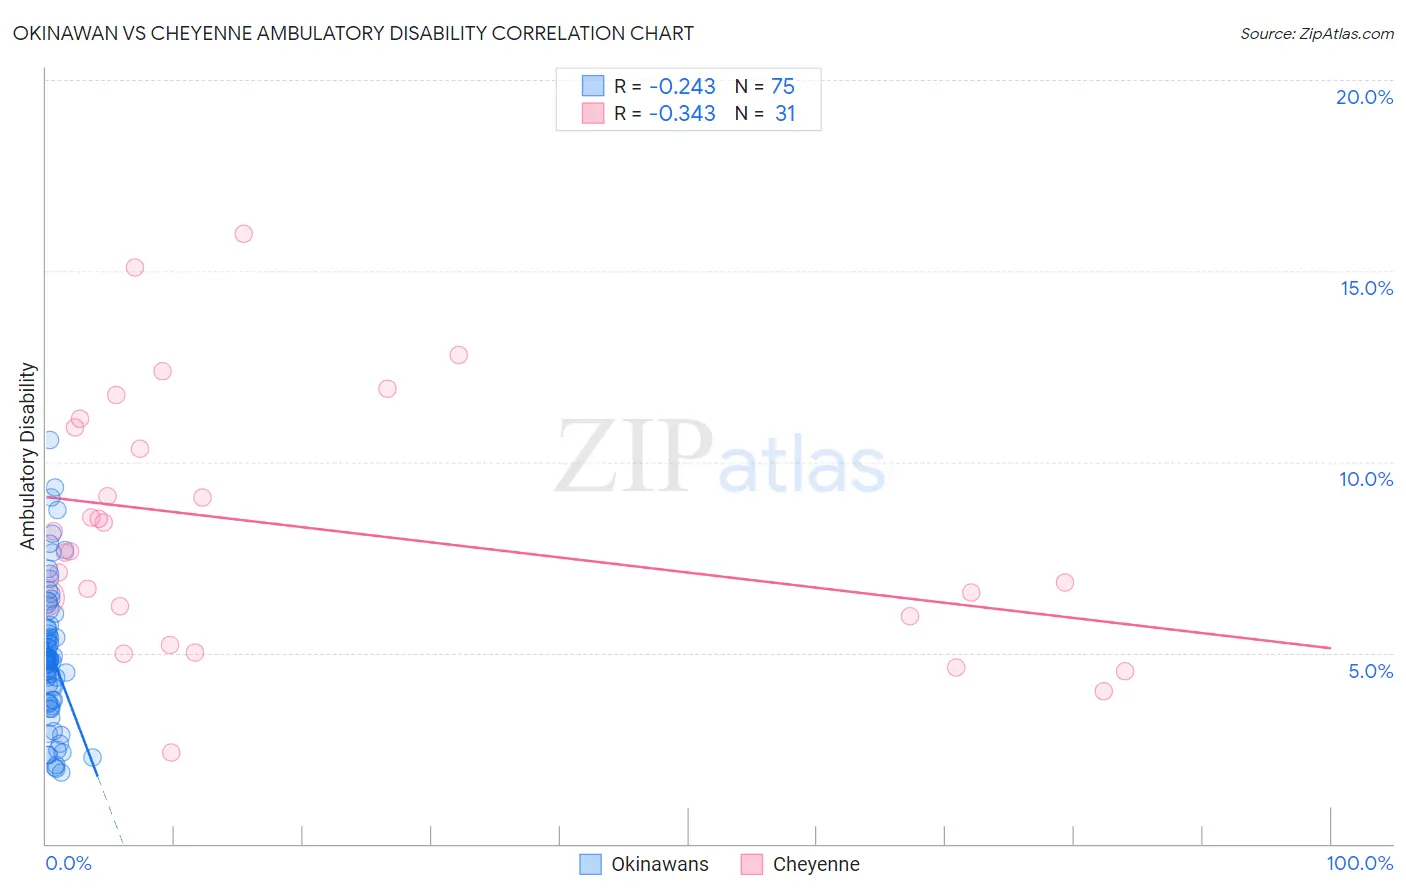
Okinawan vs Cheyenne Ambulatory Disability Correlation Chart
The statistical analysis conducted on geographies consisting of 73,734,691 people shows a weak negative correlation between the proportion of Okinawans and percentage of population with ambulatory disability in the United States with a correlation coefficient (R) of -0.243 and weighted average of 5.3%. Similarly, the statistical analysis conducted on geographies consisting of 80,709,712 people shows a mild negative correlation between the proportion of Cheyenne and percentage of population with ambulatory disability in the United States with a correlation coefficient (R) of -0.343 and weighted average of 6.9%, a difference of 30.7%.
Ambulatory Disability Correlation Summary
| Measurement | Okinawan | Cheyenne |
| Minimum | 1.9% | 2.4% |
| Maximum | 10.6% | 16.0% |
| Range | 8.7% | 13.6% |
| Mean | 4.9% | 8.3% |
| Median | 4.8% | 7.7% |
| Interquartile 25% (IQ1) | 3.7% | 6.0% |
| Interquartile 75% (IQ3) | 5.7% | 10.9% |
| Interquartile Range (IQR) | 2.0% | 4.9% |
| Standard Deviation (Sample) | 1.8% | 3.3% |
| Standard Deviation (Population) | 1.8% | 3.2% |
Similar Demographics by Ambulatory Disability
Demographics Similar to Okinawans by Ambulatory Disability
In terms of ambulatory disability, the demographic groups most similar to Okinawans are Immigrants from Korea (5.2%, a difference of 0.31%), Burmese (5.3%, a difference of 0.50%), Immigrants from Eastern Asia (5.3%, a difference of 0.65%), Immigrants from China (5.3%, a difference of 0.98%), and Immigrants from Hong Kong (5.3%, a difference of 1.5%).
| Demographics | Rating | Rank | Ambulatory Disability |
| Immigrants | Singapore | 100.0 /100 | #5 | Exceptional 5.0% |
| Immigrants | Bolivia | 100.0 /100 | #6 | Exceptional 5.0% |
| Bolivians | 100.0 /100 | #7 | Exceptional 5.1% |
| Immigrants | South Central Asia | 100.0 /100 | #8 | Exceptional 5.1% |
| Iranians | 100.0 /100 | #9 | Exceptional 5.1% |
| Yup'ik | 100.0 /100 | #10 | Exceptional 5.2% |
| Immigrants | Korea | 100.0 /100 | #11 | Exceptional 5.2% |
| Okinawans | 100.0 /100 | #12 | Exceptional 5.3% |
| Burmese | 100.0 /100 | #13 | Exceptional 5.3% |
| Immigrants | Eastern Asia | 100.0 /100 | #14 | Exceptional 5.3% |
| Immigrants | China | 100.0 /100 | #15 | Exceptional 5.3% |
| Immigrants | Hong Kong | 100.0 /100 | #16 | Exceptional 5.3% |
| Immigrants | Ethiopia | 100.0 /100 | #17 | Exceptional 5.4% |
| Immigrants | Sri Lanka | 100.0 /100 | #18 | Exceptional 5.4% |
| Indians (Asian) | 100.0 /100 | #19 | Exceptional 5.4% |
Demographics Similar to Cheyenne by Ambulatory Disability
In terms of ambulatory disability, the demographic groups most similar to Cheyenne are West Indian (6.9%, a difference of 0.060%), Scotch-Irish (6.9%, a difference of 0.16%), Immigrants from Dominica (6.9%, a difference of 0.19%), Immigrants from St. Vincent and the Grenadines (6.9%, a difference of 0.24%), and Nonimmigrants (6.9%, a difference of 0.33%).
| Demographics | Rating | Rank | Ambulatory Disability |
| Fijians | 0.0 /100 | #285 | Tragic 6.8% |
| Yakama | 0.0 /100 | #286 | Tragic 6.8% |
| U.S. Virgin Islanders | 0.0 /100 | #287 | Tragic 6.8% |
| Immigrants | Nonimmigrants | 0.0 /100 | #288 | Tragic 6.9% |
| Immigrants | Dominica | 0.0 /100 | #289 | Tragic 6.9% |
| Scotch-Irish | 0.0 /100 | #290 | Tragic 6.9% |
| West Indians | 0.0 /100 | #291 | Tragic 6.9% |
| Cheyenne | 0.0 /100 | #292 | Tragic 6.9% |
| Immigrants | St. Vincent and the Grenadines | 0.0 /100 | #293 | Tragic 6.9% |
| Cape Verdeans | 0.0 /100 | #294 | Tragic 6.9% |
| Crow | 0.0 /100 | #295 | Tragic 6.9% |
| Alaskan Athabascans | 0.0 /100 | #296 | Tragic 6.9% |
| French American Indians | 0.0 /100 | #297 | Tragic 6.9% |
| Immigrants | Grenada | 0.0 /100 | #298 | Tragic 6.9% |
| Puget Sound Salish | 0.0 /100 | #299 | Tragic 6.9% |