Okinawan vs Navajo Ambulatory Disability
COMPARE
Okinawan
Navajo
Ambulatory Disability
Ambulatory Disability Comparison
Okinawans
Navajo
5.3%
AMBULATORY DISABILITY
100.0/ 100
METRIC RATING
12th/ 347
METRIC RANK
7.5%
AMBULATORY DISABILITY
0.0/ 100
METRIC RATING
324th/ 347
METRIC RANK
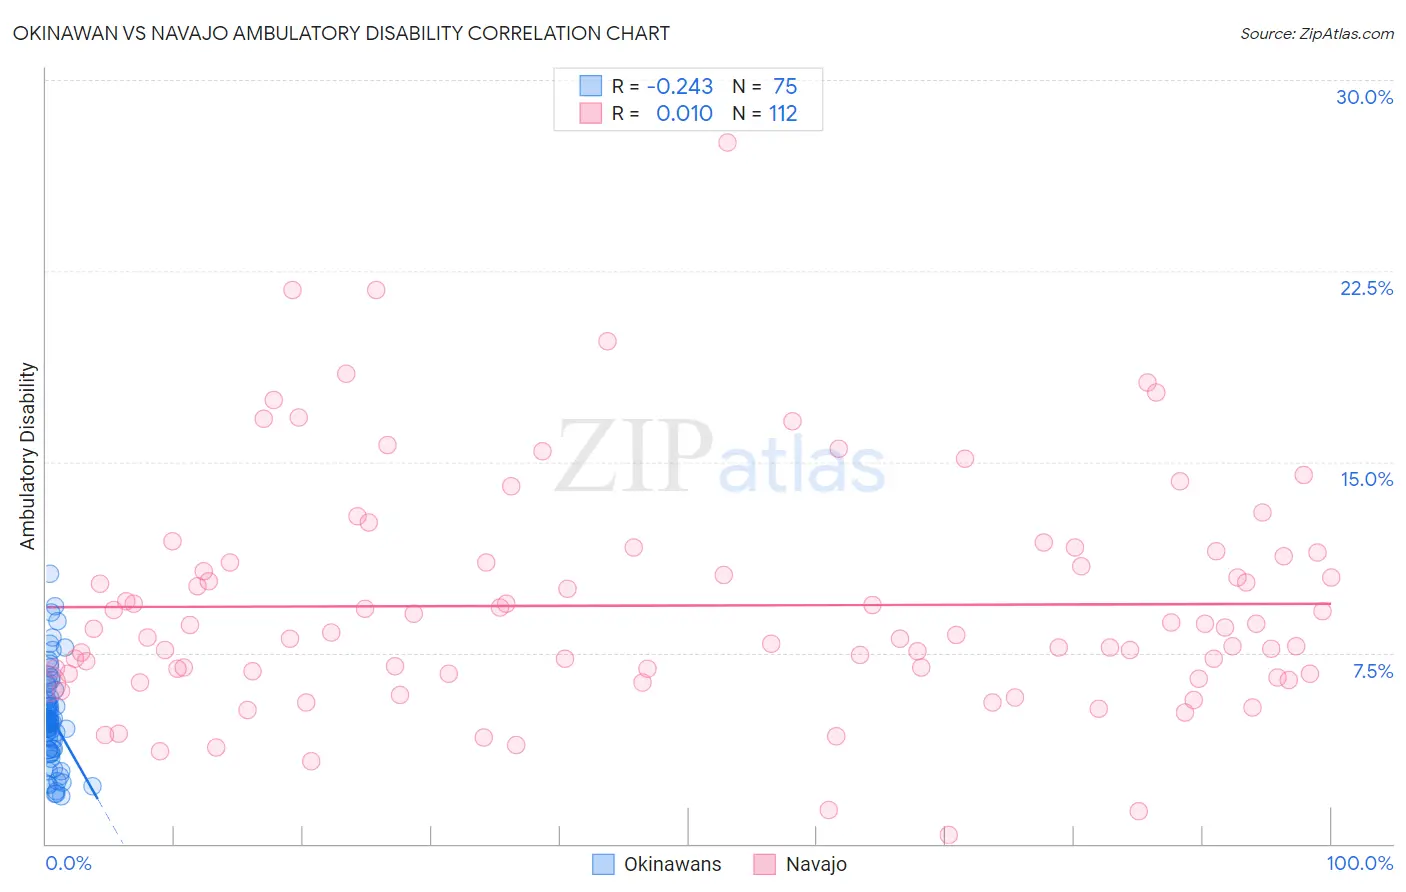
Okinawan vs Navajo Ambulatory Disability Correlation Chart
The statistical analysis conducted on geographies consisting of 73,734,691 people shows a weak negative correlation between the proportion of Okinawans and percentage of population with ambulatory disability in the United States with a correlation coefficient (R) of -0.243 and weighted average of 5.3%. Similarly, the statistical analysis conducted on geographies consisting of 224,747,889 people shows no correlation between the proportion of Navajo and percentage of population with ambulatory disability in the United States with a correlation coefficient (R) of 0.010 and weighted average of 7.5%, a difference of 42.8%.
Ambulatory Disability Correlation Summary
| Measurement | Okinawan | Navajo |
| Minimum | 1.9% | 0.36% |
| Maximum | 10.6% | 27.6% |
| Range | 8.7% | 27.2% |
| Mean | 4.9% | 9.4% |
| Median | 4.8% | 8.3% |
| Interquartile 25% (IQ1) | 3.7% | 6.7% |
| Interquartile 75% (IQ3) | 5.7% | 11.2% |
| Interquartile Range (IQR) | 2.0% | 4.5% |
| Standard Deviation (Sample) | 1.8% | 4.5% |
| Standard Deviation (Population) | 1.8% | 4.5% |
Similar Demographics by Ambulatory Disability
Demographics Similar to Okinawans by Ambulatory Disability
In terms of ambulatory disability, the demographic groups most similar to Okinawans are Immigrants from Korea (5.2%, a difference of 0.31%), Burmese (5.3%, a difference of 0.50%), Immigrants from Eastern Asia (5.3%, a difference of 0.65%), Immigrants from China (5.3%, a difference of 0.98%), and Immigrants from Hong Kong (5.3%, a difference of 1.5%).
| Demographics | Rating | Rank | Ambulatory Disability |
| Immigrants | Singapore | 100.0 /100 | #5 | Exceptional 5.0% |
| Immigrants | Bolivia | 100.0 /100 | #6 | Exceptional 5.0% |
| Bolivians | 100.0 /100 | #7 | Exceptional 5.1% |
| Immigrants | South Central Asia | 100.0 /100 | #8 | Exceptional 5.1% |
| Iranians | 100.0 /100 | #9 | Exceptional 5.1% |
| Yup'ik | 100.0 /100 | #10 | Exceptional 5.2% |
| Immigrants | Korea | 100.0 /100 | #11 | Exceptional 5.2% |
| Okinawans | 100.0 /100 | #12 | Exceptional 5.3% |
| Burmese | 100.0 /100 | #13 | Exceptional 5.3% |
| Immigrants | Eastern Asia | 100.0 /100 | #14 | Exceptional 5.3% |
| Immigrants | China | 100.0 /100 | #15 | Exceptional 5.3% |
| Immigrants | Hong Kong | 100.0 /100 | #16 | Exceptional 5.3% |
| Immigrants | Ethiopia | 100.0 /100 | #17 | Exceptional 5.4% |
| Immigrants | Sri Lanka | 100.0 /100 | #18 | Exceptional 5.4% |
| Indians (Asian) | 100.0 /100 | #19 | Exceptional 5.4% |
Demographics Similar to Navajo by Ambulatory Disability
In terms of ambulatory disability, the demographic groups most similar to Navajo are Comanche (7.5%, a difference of 0.070%), Black/African American (7.5%, a difference of 0.18%), Native/Alaskan (7.5%, a difference of 0.20%), Hopi (7.6%, a difference of 1.1%), and Pueblo (7.6%, a difference of 1.2%).
| Demographics | Rating | Rank | Ambulatory Disability |
| Central American Indians | 0.0 /100 | #317 | Tragic 7.2% |
| Ottawa | 0.0 /100 | #318 | Tragic 7.2% |
| Dominicans | 0.0 /100 | #319 | Tragic 7.2% |
| Potawatomi | 0.0 /100 | #320 | Tragic 7.3% |
| Apache | 0.0 /100 | #321 | Tragic 7.4% |
| Osage | 0.0 /100 | #322 | Tragic 7.4% |
| Americans | 0.0 /100 | #323 | Tragic 7.4% |
| Navajo | 0.0 /100 | #324 | Tragic 7.5% |
| Comanche | 0.0 /100 | #325 | Tragic 7.5% |
| Blacks/African Americans | 0.0 /100 | #326 | Tragic 7.5% |
| Natives/Alaskans | 0.0 /100 | #327 | Tragic 7.5% |
| Hopi | 0.0 /100 | #328 | Tragic 7.6% |
| Pueblo | 0.0 /100 | #329 | Tragic 7.6% |
| Paiute | 0.0 /100 | #330 | Tragic 7.7% |
| Cajuns | 0.0 /100 | #331 | Tragic 7.8% |