Norwegian vs Immigrants from Cuba Female Disability
COMPARE
Norwegian
Immigrants from Cuba
Female Disability
Female Disability Comparison
Norwegians
Immigrants from Cuba
12.3%
FEMALE DISABILITY
36.9/ 100
METRIC RATING
182nd/ 347
METRIC RANK
12.4%
FEMALE DISABILITY
20.2/ 100
METRIC RATING
206th/ 347
METRIC RANK
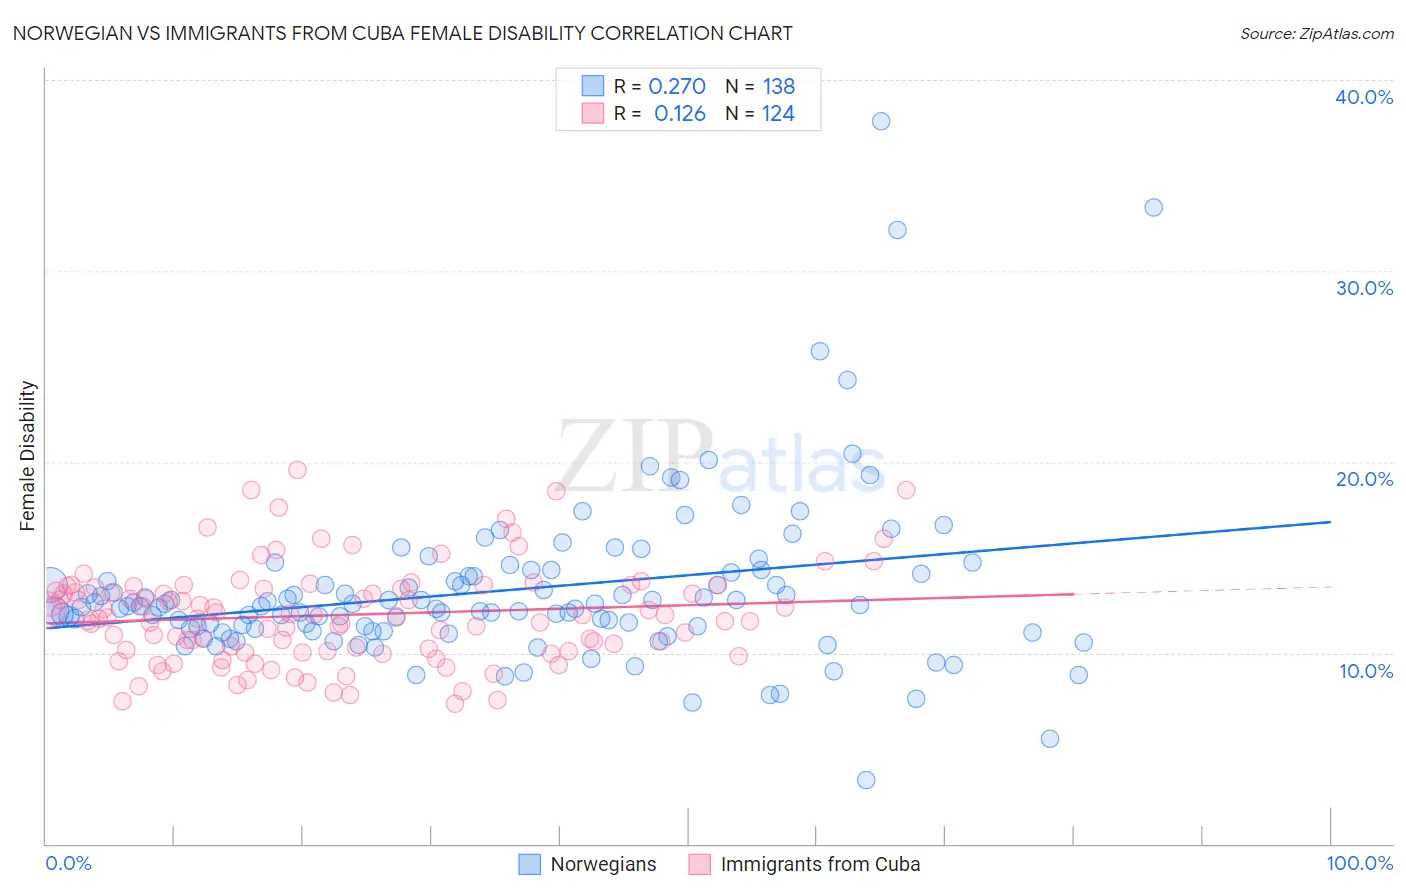
Norwegian vs Immigrants from Cuba Female Disability Correlation Chart
The statistical analysis conducted on geographies consisting of 533,161,663 people shows a weak positive correlation between the proportion of Norwegians and percentage of females with a disability in the United States with a correlation coefficient (R) of 0.270 and weighted average of 12.3%. Similarly, the statistical analysis conducted on geographies consisting of 325,981,608 people shows a poor positive correlation between the proportion of Immigrants from Cuba and percentage of females with a disability in the United States with a correlation coefficient (R) of 0.126 and weighted average of 12.4%, a difference of 0.78%.
Female Disability Correlation Summary
| Measurement | Norwegian | Immigrants from Cuba |
| Minimum | 3.3% | 7.3% |
| Maximum | 37.8% | 19.6% |
| Range | 34.5% | 12.3% |
| Mean | 13.3% | 12.0% |
| Median | 12.4% | 11.9% |
| Interquartile 25% (IQ1) | 11.3% | 10.1% |
| Interquartile 75% (IQ3) | 14.0% | 13.4% |
| Interquartile Range (IQR) | 2.8% | 3.3% |
| Standard Deviation (Sample) | 4.4% | 2.5% |
| Standard Deviation (Population) | 4.4% | 2.5% |
Similar Demographics by Female Disability
Demographics Similar to Norwegians by Female Disability
In terms of female disability, the demographic groups most similar to Norwegians are Immigrants from Canada (12.3%, a difference of 0.010%), Cuban (12.3%, a difference of 0.020%), Albanian (12.3%, a difference of 0.040%), Iraqi (12.3%, a difference of 0.040%), and Immigrants from Fiji (12.3%, a difference of 0.050%).
| Demographics | Rating | Rank | Female Disability |
| Immigrants | St. Vincent and the Grenadines | 49.7 /100 | #175 | Average 12.2% |
| Immigrants | Guyana | 43.1 /100 | #176 | Average 12.2% |
| Immigrants | Ghana | 42.5 /100 | #177 | Average 12.2% |
| Immigrants | Western Europe | 40.9 /100 | #178 | Average 12.2% |
| Immigrants | Fiji | 38.2 /100 | #179 | Fair 12.3% |
| Albanians | 37.9 /100 | #180 | Fair 12.3% |
| Immigrants | Canada | 37.2 /100 | #181 | Fair 12.3% |
| Norwegians | 36.9 /100 | #182 | Fair 12.3% |
| Cubans | 36.5 /100 | #183 | Fair 12.3% |
| Iraqis | 36.0 /100 | #184 | Fair 12.3% |
| Immigrants | Uzbekistan | 33.9 /100 | #185 | Fair 12.3% |
| Austrians | 33.3 /100 | #186 | Fair 12.3% |
| Serbians | 33.1 /100 | #187 | Fair 12.3% |
| Immigrants | North America | 32.8 /100 | #188 | Fair 12.3% |
| Immigrants | Albania | 31.6 /100 | #189 | Fair 12.3% |
Demographics Similar to Immigrants from Cuba by Female Disability
In terms of female disability, the demographic groups most similar to Immigrants from Cuba are Croatian (12.4%, a difference of 0.0%), Immigrants from Grenada (12.4%, a difference of 0.020%), Immigrants from Zaire (12.3%, a difference of 0.040%), Immigrants from Barbados (12.3%, a difference of 0.050%), and Somali (12.3%, a difference of 0.070%).
| Demographics | Rating | Rank | Female Disability |
| Immigrants | Trinidad and Tobago | 24.7 /100 | #199 | Fair 12.3% |
| Trinidadians and Tobagonians | 22.4 /100 | #200 | Fair 12.3% |
| Chinese | 22.1 /100 | #201 | Fair 12.3% |
| Somalis | 21.5 /100 | #202 | Fair 12.3% |
| Immigrants | Barbados | 21.1 /100 | #203 | Fair 12.3% |
| Immigrants | Zaire | 20.9 /100 | #204 | Fair 12.3% |
| Immigrants | Grenada | 20.5 /100 | #205 | Fair 12.4% |
| Immigrants | Cuba | 20.2 /100 | #206 | Fair 12.4% |
| Croatians | 20.2 /100 | #207 | Fair 12.4% |
| Basques | 17.5 /100 | #208 | Poor 12.4% |
| Mexicans | 15.7 /100 | #209 | Poor 12.4% |
| Swiss | 14.9 /100 | #210 | Poor 12.4% |
| Immigrants | Bosnia and Herzegovina | 14.8 /100 | #211 | Poor 12.4% |
| Ute | 14.7 /100 | #212 | Poor 12.4% |
| Immigrants | Thailand | 14.5 /100 | #213 | Poor 12.4% |