Norwegian vs Immigrants from Uganda Female Disability
COMPARE
Norwegian
Immigrants from Uganda
Female Disability
Female Disability Comparison
Norwegians
Immigrants from Uganda
12.3%
FEMALE DISABILITY
36.9/ 100
METRIC RATING
182nd/ 347
METRIC RANK
11.8%
FEMALE DISABILITY
97.2/ 100
METRIC RATING
119th/ 347
METRIC RANK
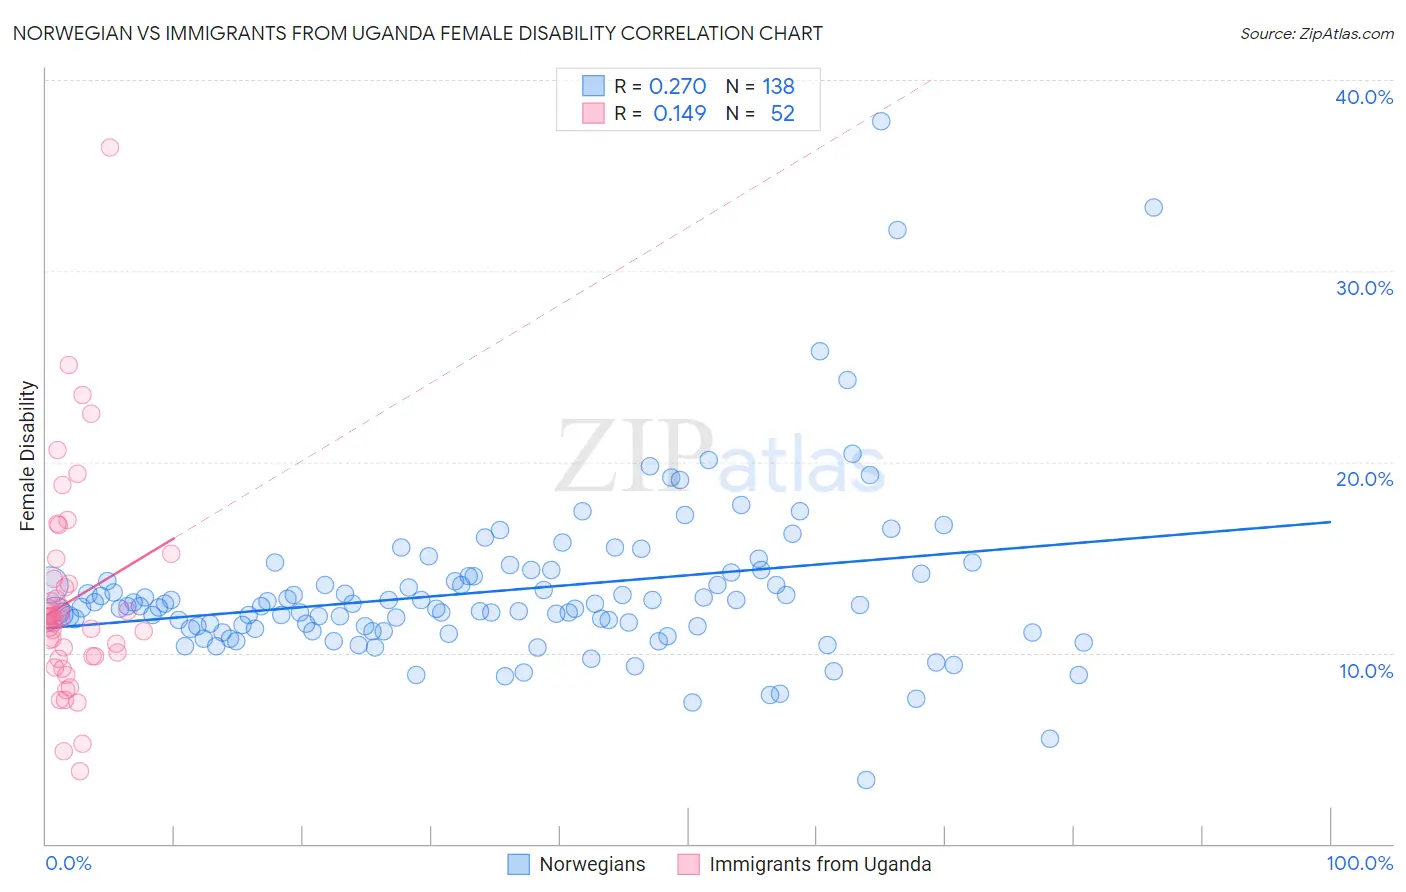
Norwegian vs Immigrants from Uganda Female Disability Correlation Chart
The statistical analysis conducted on geographies consisting of 533,161,663 people shows a weak positive correlation between the proportion of Norwegians and percentage of females with a disability in the United States with a correlation coefficient (R) of 0.270 and weighted average of 12.3%. Similarly, the statistical analysis conducted on geographies consisting of 125,980,314 people shows a poor positive correlation between the proportion of Immigrants from Uganda and percentage of females with a disability in the United States with a correlation coefficient (R) of 0.149 and weighted average of 11.8%, a difference of 4.0%.
Female Disability Correlation Summary
| Measurement | Norwegian | Immigrants from Uganda |
| Minimum | 3.3% | 3.8% |
| Maximum | 37.8% | 36.5% |
| Range | 34.5% | 32.6% |
| Mean | 13.3% | 12.7% |
| Median | 12.4% | 11.8% |
| Interquartile 25% (IQ1) | 11.3% | 9.8% |
| Interquartile 75% (IQ3) | 14.0% | 13.7% |
| Interquartile Range (IQR) | 2.8% | 3.9% |
| Standard Deviation (Sample) | 4.4% | 5.5% |
| Standard Deviation (Population) | 4.4% | 5.5% |
Similar Demographics by Female Disability
Demographics Similar to Norwegians by Female Disability
In terms of female disability, the demographic groups most similar to Norwegians are Immigrants from Canada (12.3%, a difference of 0.010%), Cuban (12.3%, a difference of 0.020%), Albanian (12.3%, a difference of 0.040%), Iraqi (12.3%, a difference of 0.040%), and Immigrants from Fiji (12.3%, a difference of 0.050%).
| Demographics | Rating | Rank | Female Disability |
| Immigrants | St. Vincent and the Grenadines | 49.7 /100 | #175 | Average 12.2% |
| Immigrants | Guyana | 43.1 /100 | #176 | Average 12.2% |
| Immigrants | Ghana | 42.5 /100 | #177 | Average 12.2% |
| Immigrants | Western Europe | 40.9 /100 | #178 | Average 12.2% |
| Immigrants | Fiji | 38.2 /100 | #179 | Fair 12.3% |
| Albanians | 37.9 /100 | #180 | Fair 12.3% |
| Immigrants | Canada | 37.2 /100 | #181 | Fair 12.3% |
| Norwegians | 36.9 /100 | #182 | Fair 12.3% |
| Cubans | 36.5 /100 | #183 | Fair 12.3% |
| Iraqis | 36.0 /100 | #184 | Fair 12.3% |
| Immigrants | Uzbekistan | 33.9 /100 | #185 | Fair 12.3% |
| Austrians | 33.3 /100 | #186 | Fair 12.3% |
| Serbians | 33.1 /100 | #187 | Fair 12.3% |
| Immigrants | North America | 32.8 /100 | #188 | Fair 12.3% |
| Immigrants | Albania | 31.6 /100 | #189 | Fair 12.3% |
Demographics Similar to Immigrants from Uganda by Female Disability
In terms of female disability, the demographic groups most similar to Immigrants from Uganda are Immigrants from Eastern Europe (11.8%, a difference of 0.010%), Immigrants from Nigeria (11.8%, a difference of 0.010%), Immigrants from Kazakhstan (11.8%, a difference of 0.080%), Immigrants from Netherlands (11.8%, a difference of 0.11%), and Immigrants from North Macedonia (11.8%, a difference of 0.12%).
| Demographics | Rating | Rank | Female Disability |
| Immigrants | Bangladesh | 97.8 /100 | #112 | Exceptional 11.8% |
| Immigrants | Belarus | 97.8 /100 | #113 | Exceptional 11.8% |
| South Africans | 97.7 /100 | #114 | Exceptional 11.8% |
| Brazilians | 97.7 /100 | #115 | Exceptional 11.8% |
| Immigrants | Morocco | 97.6 /100 | #116 | Exceptional 11.8% |
| Immigrants | Eastern Europe | 97.2 /100 | #117 | Exceptional 11.8% |
| Immigrants | Nigeria | 97.2 /100 | #118 | Exceptional 11.8% |
| Immigrants | Uganda | 97.2 /100 | #119 | Exceptional 11.8% |
| Immigrants | Kazakhstan | 97.0 /100 | #120 | Exceptional 11.8% |
| Immigrants | Netherlands | 96.9 /100 | #121 | Exceptional 11.8% |
| Immigrants | North Macedonia | 96.8 /100 | #122 | Exceptional 11.8% |
| Immigrants | Croatia | 96.7 /100 | #123 | Exceptional 11.8% |
| Russians | 96.5 /100 | #124 | Exceptional 11.8% |
| Immigrants | Italy | 96.4 /100 | #125 | Exceptional 11.8% |
| Immigrants | Europe | 96.2 /100 | #126 | Exceptional 11.8% |