Mexican American Indian vs Shoshone Disability Age Under 5
COMPARE
Mexican American Indian
Shoshone
Disability Age Under 5
Disability Age Under 5 Comparison
Mexican American Indians
Shoshone
1.3%
DISABILITY AGE UNDER 5
36.6/ 100
METRIC RATING
191st/ 347
METRIC RANK
1.6%
DISABILITY AGE UNDER 5
0.0/ 100
METRIC RATING
300th/ 347
METRIC RANK
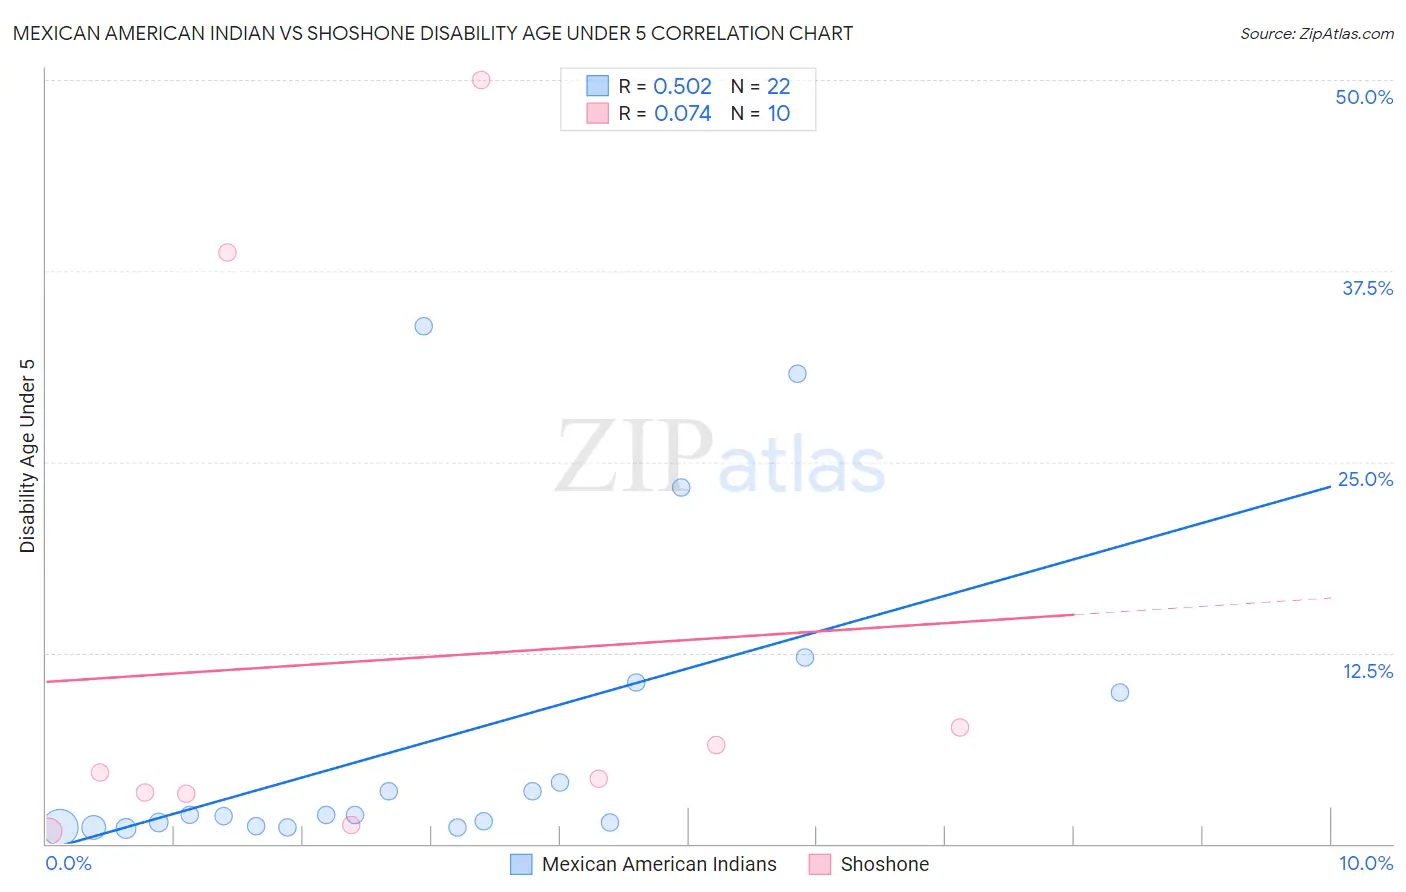
Mexican American Indian vs Shoshone Disability Age Under 5 Correlation Chart
The statistical analysis conducted on geographies consisting of 193,676,549 people shows a substantial positive correlation between the proportion of Mexican American Indians and percentage of population with a disability under the age of 5 in the United States with a correlation coefficient (R) of 0.502 and weighted average of 1.3%. Similarly, the statistical analysis conducted on geographies consisting of 55,591,533 people shows a slight positive correlation between the proportion of Shoshone and percentage of population with a disability under the age of 5 in the United States with a correlation coefficient (R) of 0.074 and weighted average of 1.6%, a difference of 29.1%.
Disability Age Under 5 Correlation Summary
| Measurement | Mexican American Indian | Shoshone |
| Minimum | 1.0% | 0.81% |
| Maximum | 33.9% | 50.0% |
| Range | 32.9% | 49.2% |
| Mean | 6.8% | 12.0% |
| Median | 1.9% | 4.5% |
| Interquartile 25% (IQ1) | 1.2% | 3.3% |
| Interquartile 75% (IQ3) | 9.9% | 7.6% |
| Interquartile Range (IQR) | 8.7% | 4.3% |
| Standard Deviation (Sample) | 9.9% | 17.4% |
| Standard Deviation (Population) | 9.6% | 16.5% |
Similar Demographics by Disability Age Under 5
Demographics Similar to Mexican American Indians by Disability Age Under 5
In terms of disability age under 5, the demographic groups most similar to Mexican American Indians are Immigrants from Bosnia and Herzegovina (1.3%, a difference of 0.0%), Immigrants from Sierra Leone (1.3%, a difference of 0.0%), Immigrants from Laos (1.3%, a difference of 0.010%), Peruvian (1.3%, a difference of 0.10%), and Immigrants from North Macedonia (1.3%, a difference of 0.18%).
| Demographics | Rating | Rank | Disability Age Under 5 |
| Palestinians | 43.0 /100 | #184 | Average 1.2% |
| Immigrants | Western Africa | 42.5 /100 | #185 | Average 1.2% |
| Cubans | 42.5 /100 | #186 | Average 1.2% |
| Immigrants | Haiti | 40.2 /100 | #187 | Average 1.3% |
| Haitians | 39.9 /100 | #188 | Fair 1.3% |
| Peruvians | 37.6 /100 | #189 | Fair 1.3% |
| Immigrants | Laos | 36.6 /100 | #190 | Fair 1.3% |
| Mexican American Indians | 36.6 /100 | #191 | Fair 1.3% |
| Immigrants | Bosnia and Herzegovina | 36.5 /100 | #192 | Fair 1.3% |
| Immigrants | Sierra Leone | 36.5 /100 | #193 | Fair 1.3% |
| Immigrants | North Macedonia | 34.7 /100 | #194 | Fair 1.3% |
| U.S. Virgin Islanders | 34.4 /100 | #195 | Fair 1.3% |
| Immigrants | Belgium | 31.4 /100 | #196 | Fair 1.3% |
| Immigrants | Somalia | 31.3 /100 | #197 | Fair 1.3% |
| Immigrants | Norway | 31.1 /100 | #198 | Fair 1.3% |
Demographics Similar to Shoshone by Disability Age Under 5
In terms of disability age under 5, the demographic groups most similar to Shoshone are Portuguese (1.6%, a difference of 0.33%), German Russian (1.6%, a difference of 0.44%), Welsh (1.6%, a difference of 0.56%), Swiss (1.6%, a difference of 0.72%), and Nonimmigrants (1.6%, a difference of 0.91%).
| Demographics | Rating | Rank | Disability Age Under 5 |
| Lithuanians | 0.0 /100 | #293 | Tragic 1.6% |
| Swedes | 0.0 /100 | #294 | Tragic 1.6% |
| Finns | 0.0 /100 | #295 | Tragic 1.6% |
| Poles | 0.0 /100 | #296 | Tragic 1.6% |
| Immigrants | Nonimmigrants | 0.0 /100 | #297 | Tragic 1.6% |
| Cajuns | 0.0 /100 | #298 | Tragic 1.6% |
| Portuguese | 0.0 /100 | #299 | Tragic 1.6% |
| Shoshone | 0.0 /100 | #300 | Tragic 1.6% |
| German Russians | 0.0 /100 | #301 | Tragic 1.6% |
| Welsh | 0.0 /100 | #302 | Tragic 1.6% |
| Swiss | 0.0 /100 | #303 | Tragic 1.6% |
| Seminole | 0.0 /100 | #304 | Tragic 1.6% |
| Blackfeet | 0.0 /100 | #305 | Tragic 1.6% |
| Creek | 0.0 /100 | #306 | Tragic 1.6% |
| Scottish | 0.0 /100 | #307 | Tragic 1.6% |