Japanese vs Shoshone Disability Age Under 5
COMPARE
Japanese
Shoshone
Disability Age Under 5
Disability Age Under 5 Comparison
Japanese
Shoshone
1.2%
DISABILITY AGE UNDER 5
90.3/ 100
METRIC RATING
125th/ 347
METRIC RANK
1.6%
DISABILITY AGE UNDER 5
0.0/ 100
METRIC RATING
300th/ 347
METRIC RANK
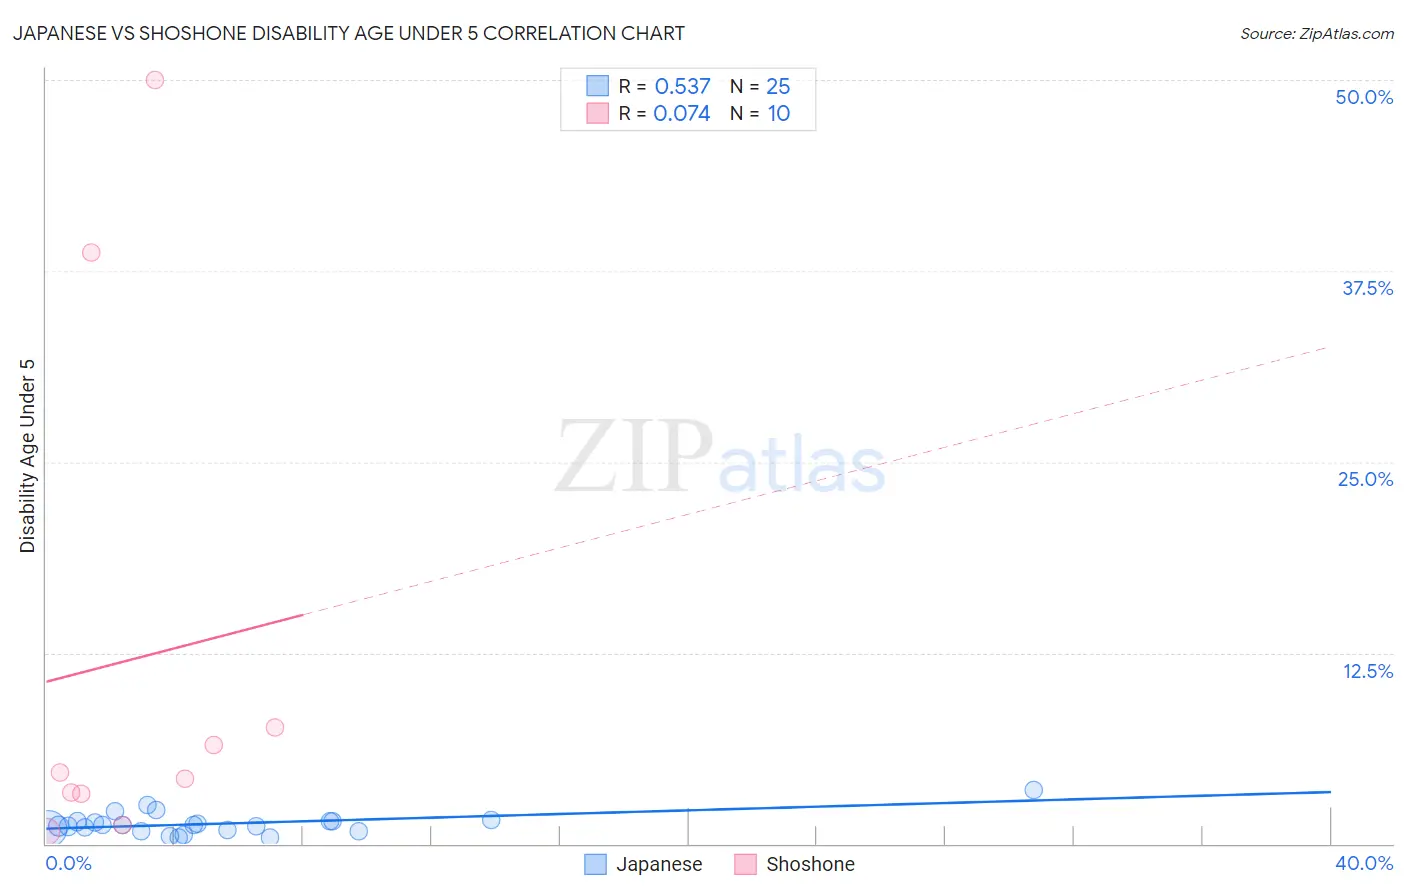
Japanese vs Shoshone Disability Age Under 5 Correlation Chart
The statistical analysis conducted on geographies consisting of 161,189,921 people shows a substantial positive correlation between the proportion of Japanese and percentage of population with a disability under the age of 5 in the United States with a correlation coefficient (R) of 0.537 and weighted average of 1.2%. Similarly, the statistical analysis conducted on geographies consisting of 55,591,533 people shows a slight positive correlation between the proportion of Shoshone and percentage of population with a disability under the age of 5 in the United States with a correlation coefficient (R) of 0.074 and weighted average of 1.6%, a difference of 37.6%.
Disability Age Under 5 Correlation Summary
| Measurement | Japanese | Shoshone |
| Minimum | 0.40% | 0.81% |
| Maximum | 3.5% | 50.0% |
| Range | 3.1% | 49.2% |
| Mean | 1.3% | 12.0% |
| Median | 1.2% | 4.5% |
| Interquartile 25% (IQ1) | 0.87% | 3.3% |
| Interquartile 75% (IQ3) | 1.4% | 7.6% |
| Interquartile Range (IQR) | 0.58% | 4.3% |
| Standard Deviation (Sample) | 0.70% | 17.4% |
| Standard Deviation (Population) | 0.69% | 16.5% |
Similar Demographics by Disability Age Under 5
Demographics Similar to Japanese by Disability Age Under 5
In terms of disability age under 5, the demographic groups most similar to Japanese are Immigrants from Cambodia (1.2%, a difference of 0.060%), Zimbabwean (1.2%, a difference of 0.080%), Aleut (1.2%, a difference of 0.13%), Central American (1.2%, a difference of 0.16%), and Immigrants from Senegal (1.2%, a difference of 0.32%).
| Demographics | Rating | Rank | Disability Age Under 5 |
| Immigrants | Venezuela | 93.4 /100 | #118 | Exceptional 1.2% |
| Bhutanese | 92.5 /100 | #119 | Exceptional 1.2% |
| Immigrants | Eritrea | 92.3 /100 | #120 | Exceptional 1.2% |
| Immigrants | Senegal | 91.4 /100 | #121 | Exceptional 1.2% |
| Aleuts | 90.7 /100 | #122 | Exceptional 1.2% |
| Zimbabweans | 90.6 /100 | #123 | Exceptional 1.2% |
| Immigrants | Cambodia | 90.5 /100 | #124 | Exceptional 1.2% |
| Japanese | 90.3 /100 | #125 | Exceptional 1.2% |
| Central Americans | 89.7 /100 | #126 | Excellent 1.2% |
| Immigrants | Romania | 88.4 /100 | #127 | Excellent 1.2% |
| Immigrants | France | 88.4 /100 | #128 | Excellent 1.2% |
| Immigrants | Immigrants | 88.0 /100 | #129 | Excellent 1.2% |
| Koreans | 87.7 /100 | #130 | Excellent 1.2% |
| Immigrants | Serbia | 87.6 /100 | #131 | Excellent 1.2% |
| Immigrants | Eastern Europe | 87.3 /100 | #132 | Excellent 1.2% |
Demographics Similar to Shoshone by Disability Age Under 5
In terms of disability age under 5, the demographic groups most similar to Shoshone are Portuguese (1.6%, a difference of 0.33%), German Russian (1.6%, a difference of 0.44%), Welsh (1.6%, a difference of 0.56%), Swiss (1.6%, a difference of 0.72%), and Nonimmigrants (1.6%, a difference of 0.91%).
| Demographics | Rating | Rank | Disability Age Under 5 |
| Lithuanians | 0.0 /100 | #293 | Tragic 1.6% |
| Swedes | 0.0 /100 | #294 | Tragic 1.6% |
| Finns | 0.0 /100 | #295 | Tragic 1.6% |
| Poles | 0.0 /100 | #296 | Tragic 1.6% |
| Immigrants | Nonimmigrants | 0.0 /100 | #297 | Tragic 1.6% |
| Cajuns | 0.0 /100 | #298 | Tragic 1.6% |
| Portuguese | 0.0 /100 | #299 | Tragic 1.6% |
| Shoshone | 0.0 /100 | #300 | Tragic 1.6% |
| German Russians | 0.0 /100 | #301 | Tragic 1.6% |
| Welsh | 0.0 /100 | #302 | Tragic 1.6% |
| Swiss | 0.0 /100 | #303 | Tragic 1.6% |
| Seminole | 0.0 /100 | #304 | Tragic 1.6% |
| Blackfeet | 0.0 /100 | #305 | Tragic 1.6% |
| Creek | 0.0 /100 | #306 | Tragic 1.6% |
| Scottish | 0.0 /100 | #307 | Tragic 1.6% |