Nonimmigrants vs Apache Female Disability
COMPARE
Nonimmigrants
Apache
Female Disability
Female Disability Comparison
Nonimmigrants
Apache
13.4%
FEMALE DISABILITY
0.0/ 100
METRIC RATING
298th/ 347
METRIC RANK
13.7%
FEMALE DISABILITY
0.0/ 100
METRIC RATING
310th/ 347
METRIC RANK
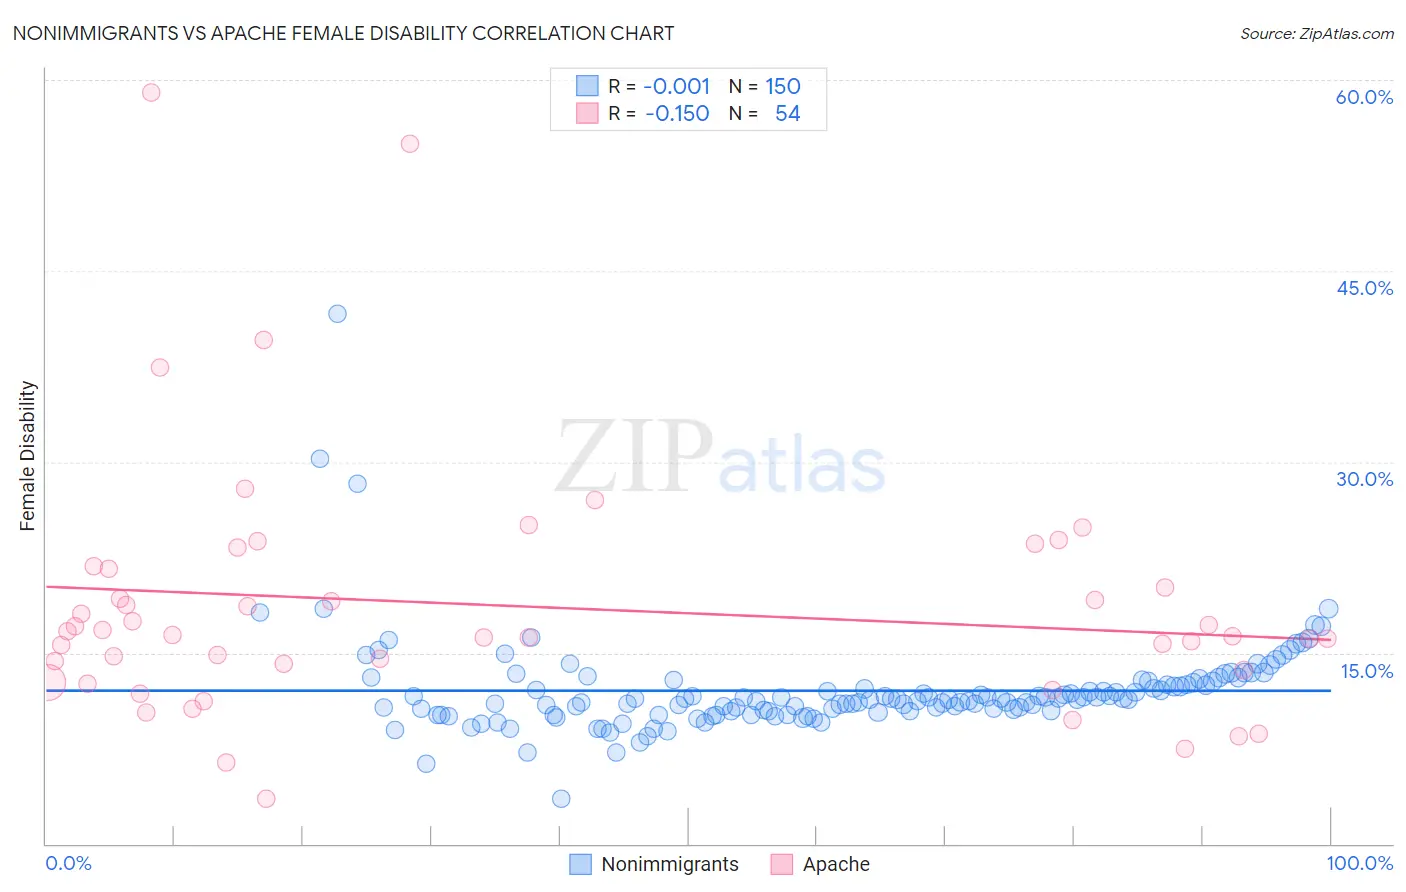
Nonimmigrants vs Apache Female Disability Correlation Chart
The statistical analysis conducted on geographies consisting of 584,611,893 people shows no correlation between the proportion of Nonimmigrants and percentage of females with a disability in the United States with a correlation coefficient (R) of -0.001 and weighted average of 13.4%. Similarly, the statistical analysis conducted on geographies consisting of 231,061,138 people shows a poor negative correlation between the proportion of Apache and percentage of females with a disability in the United States with a correlation coefficient (R) of -0.150 and weighted average of 13.7%, a difference of 2.5%.
Female Disability Correlation Summary
| Measurement | Nonimmigrants | Apache |
| Minimum | 3.5% | 3.6% |
| Maximum | 41.7% | 59.0% |
| Range | 38.2% | 55.5% |
| Mean | 12.0% | 18.7% |
| Median | 11.4% | 16.3% |
| Interquartile 25% (IQ1) | 10.4% | 13.7% |
| Interquartile 75% (IQ3) | 12.7% | 21.6% |
| Interquartile Range (IQR) | 2.2% | 7.9% |
| Standard Deviation (Sample) | 3.9% | 10.1% |
| Standard Deviation (Population) | 3.8% | 10.0% |
Demographics Similar to Nonimmigrants and Apache by Female Disability
In terms of female disability, the demographic groups most similar to Nonimmigrants are Immigrants from Dominican Republic (13.4%, a difference of 0.26%), Pennsylvania German (13.4%, a difference of 0.27%), Slovak (13.3%, a difference of 0.30%), Nepalese (13.3%, a difference of 0.34%), and French (13.3%, a difference of 0.47%). Similarly, the demographic groups most similar to Apache are French American Indian (13.7%, a difference of 0.12%), Cree (13.7%, a difference of 0.18%), Hopi (13.7%, a difference of 0.29%), Delaware (13.8%, a difference of 0.60%), and Central American Indian (13.6%, a difference of 0.63%).
| Demographics | Rating | Rank | Female Disability |
| Celtics | 0.0 /100 | #294 | Tragic 13.3% |
| French | 0.0 /100 | #295 | Tragic 13.3% |
| Nepalese | 0.0 /100 | #296 | Tragic 13.3% |
| Slovaks | 0.0 /100 | #297 | Tragic 13.3% |
| Immigrants | Nonimmigrants | 0.0 /100 | #298 | Tragic 13.4% |
| Immigrants | Dominican Republic | 0.0 /100 | #299 | Tragic 13.4% |
| Pennsylvania Germans | 0.0 /100 | #300 | Tragic 13.4% |
| Africans | 0.0 /100 | #301 | Tragic 13.4% |
| Scotch-Irish | 0.0 /100 | #302 | Tragic 13.4% |
| Immigrants | Portugal | 0.0 /100 | #303 | Tragic 13.5% |
| Immigrants | Micronesia | 0.0 /100 | #304 | Tragic 13.5% |
| Dominicans | 0.0 /100 | #305 | Tragic 13.5% |
| French Canadians | 0.0 /100 | #306 | Tragic 13.6% |
| Central American Indians | 0.0 /100 | #307 | Tragic 13.6% |
| Cree | 0.0 /100 | #308 | Tragic 13.7% |
| French American Indians | 0.0 /100 | #309 | Tragic 13.7% |
| Apache | 0.0 /100 | #310 | Tragic 13.7% |
| Hopi | 0.0 /100 | #311 | Tragic 13.7% |
| Delaware | 0.0 /100 | #312 | Tragic 13.8% |
| Blackfeet | 0.0 /100 | #313 | Tragic 13.8% |
| Puget Sound Salish | 0.0 /100 | #314 | Tragic 13.8% |