Nonimmigrants vs Apache Female Poverty Among 25-34 Year Olds
COMPARE
Nonimmigrants
Apache
Female Poverty Among 25-34 Year Olds
Female Poverty Among 25-34 Year Olds Comparison
Nonimmigrants
Apache
15.6%
FEMALE POVERTY AMONG 25-34 YEAR OLDS
0.1/ 100
METRIC RATING
273rd/ 347
METRIC RANK
20.1%
FEMALE POVERTY AMONG 25-34 YEAR OLDS
0.0/ 100
METRIC RATING
334th/ 347
METRIC RANK
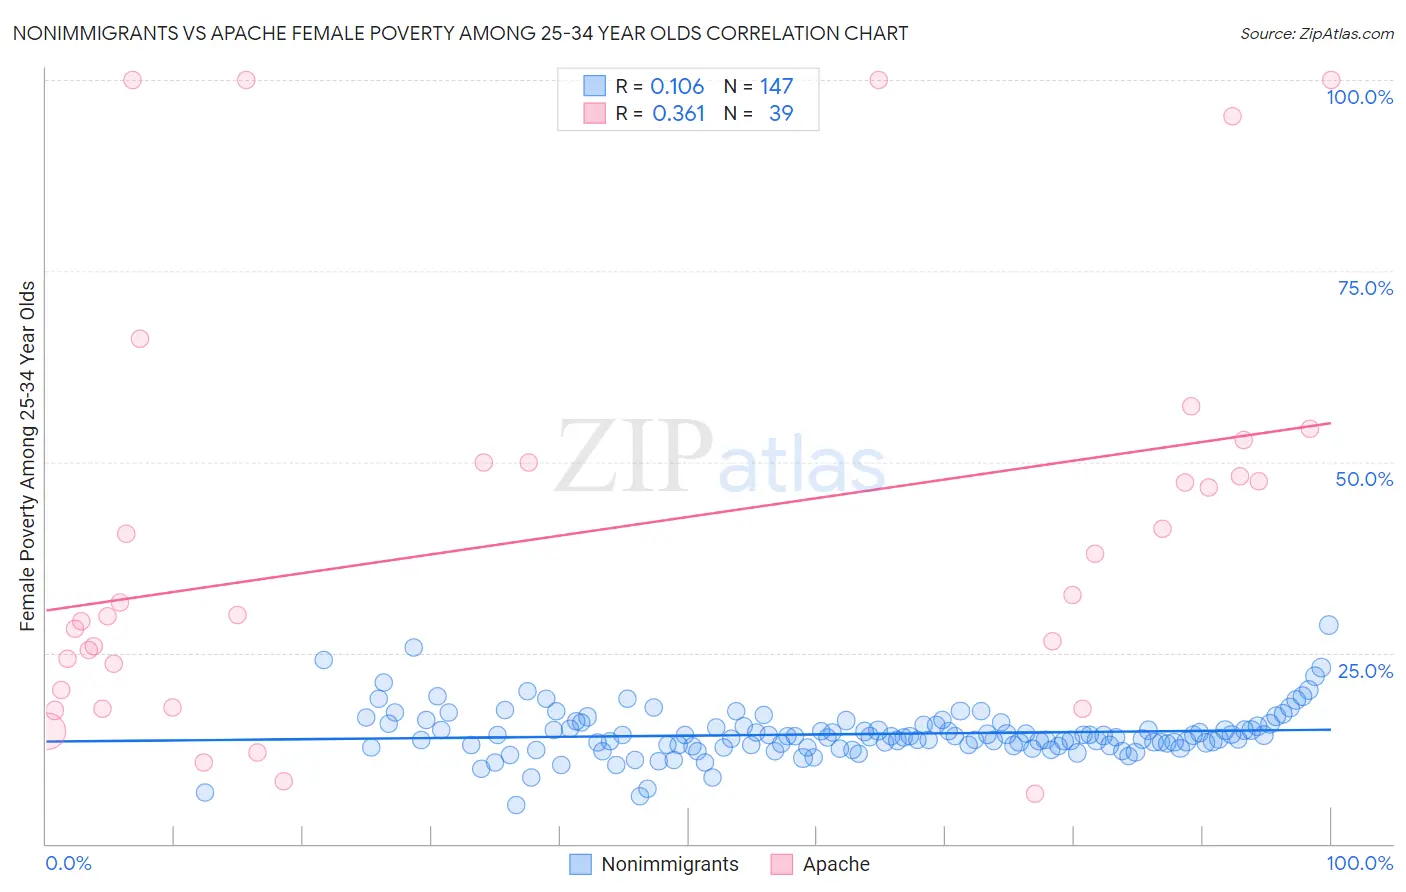
Nonimmigrants vs Apache Female Poverty Among 25-34 Year Olds Correlation Chart
The statistical analysis conducted on geographies consisting of 559,225,521 people shows a poor positive correlation between the proportion of Nonimmigrants and poverty level among females between the ages 25 and 34 in the United States with a correlation coefficient (R) of 0.106 and weighted average of 15.6%. Similarly, the statistical analysis conducted on geographies consisting of 229,799,768 people shows a mild positive correlation between the proportion of Apache and poverty level among females between the ages 25 and 34 in the United States with a correlation coefficient (R) of 0.361 and weighted average of 20.1%, a difference of 28.4%.
Female Poverty Among 25-34 Year Olds Correlation Summary
| Measurement | Nonimmigrants | Apache |
| Minimum | 5.1% | 6.5% |
| Maximum | 28.6% | 100.0% |
| Range | 23.5% | 93.5% |
| Mean | 14.4% | 40.6% |
| Median | 14.0% | 31.6% |
| Interquartile 25% (IQ1) | 12.9% | 20.2% |
| Interquartile 75% (IQ3) | 15.5% | 50.0% |
| Interquartile Range (IQR) | 2.7% | 29.8% |
| Standard Deviation (Sample) | 3.2% | 27.0% |
| Standard Deviation (Population) | 3.2% | 26.7% |
Similar Demographics by Female Poverty Among 25-34 Year Olds
Demographics Similar to Nonimmigrants by Female Poverty Among 25-34 Year Olds
In terms of female poverty among 25-34 year olds, the demographic groups most similar to Nonimmigrants are Senegalese (15.6%, a difference of 0.11%), Cree (15.6%, a difference of 0.17%), British West Indian (15.6%, a difference of 0.18%), Subsaharan African (15.6%, a difference of 0.33%), and Immigrants from Caribbean (15.7%, a difference of 0.49%).
| Demographics | Rating | Rank | Female Poverty Among 25-34 Year Olds |
| Immigrants | Somalia | 0.1 /100 | #266 | Tragic 15.4% |
| Central Americans | 0.1 /100 | #267 | Tragic 15.5% |
| Immigrants | Senegal | 0.1 /100 | #268 | Tragic 15.6% |
| Sub-Saharan Africans | 0.1 /100 | #269 | Tragic 15.6% |
| British West Indians | 0.1 /100 | #270 | Tragic 15.6% |
| Cree | 0.1 /100 | #271 | Tragic 15.6% |
| Senegalese | 0.1 /100 | #272 | Tragic 15.6% |
| Immigrants | Nonimmigrants | 0.1 /100 | #273 | Tragic 15.6% |
| Immigrants | Caribbean | 0.0 /100 | #274 | Tragic 15.7% |
| Immigrants | Azores | 0.0 /100 | #275 | Tragic 15.8% |
| Immigrants | Zaire | 0.0 /100 | #276 | Tragic 15.8% |
| Immigrants | Micronesia | 0.0 /100 | #277 | Tragic 15.8% |
| French American Indians | 0.0 /100 | #278 | Tragic 15.9% |
| Fijians | 0.0 /100 | #279 | Tragic 15.9% |
| Bangladeshis | 0.0 /100 | #280 | Tragic 15.9% |
Demographics Similar to Apache by Female Poverty Among 25-34 Year Olds
In terms of female poverty among 25-34 year olds, the demographic groups most similar to Apache are Cajun (19.9%, a difference of 0.68%), Native/Alaskan (20.3%, a difference of 1.1%), Immigrants from Yemen (19.8%, a difference of 1.5%), Kiowa (19.7%, a difference of 2.1%), and Paiute (19.6%, a difference of 2.5%).
| Demographics | Rating | Rank | Female Poverty Among 25-34 Year Olds |
| Cheyenne | 0.0 /100 | #327 | Tragic 19.1% |
| Alaskan Athabascans | 0.0 /100 | #328 | Tragic 19.1% |
| Creek | 0.0 /100 | #329 | Tragic 19.2% |
| Paiute | 0.0 /100 | #330 | Tragic 19.6% |
| Kiowa | 0.0 /100 | #331 | Tragic 19.7% |
| Immigrants | Yemen | 0.0 /100 | #332 | Tragic 19.8% |
| Cajuns | 0.0 /100 | #333 | Tragic 19.9% |
| Apache | 0.0 /100 | #334 | Tragic 20.1% |
| Natives/Alaskans | 0.0 /100 | #335 | Tragic 20.3% |
| Pueblo | 0.0 /100 | #336 | Tragic 22.2% |
| Crow | 0.0 /100 | #337 | Tragic 22.7% |
| Houma | 0.0 /100 | #338 | Tragic 22.7% |
| Yuman | 0.0 /100 | #339 | Tragic 22.9% |
| Sioux | 0.0 /100 | #340 | Tragic 23.0% |
| Navajo | 0.0 /100 | #341 | Tragic 23.3% |