Nonimmigrants vs Filipino Female Disability
COMPARE
Nonimmigrants
Filipino
Female Disability
Female Disability Comparison
Nonimmigrants
Filipinos
13.4%
FEMALE DISABILITY
0.0/ 100
METRIC RATING
298th/ 347
METRIC RANK
10.1%
FEMALE DISABILITY
100.0/ 100
METRIC RATING
2nd/ 347
METRIC RANK
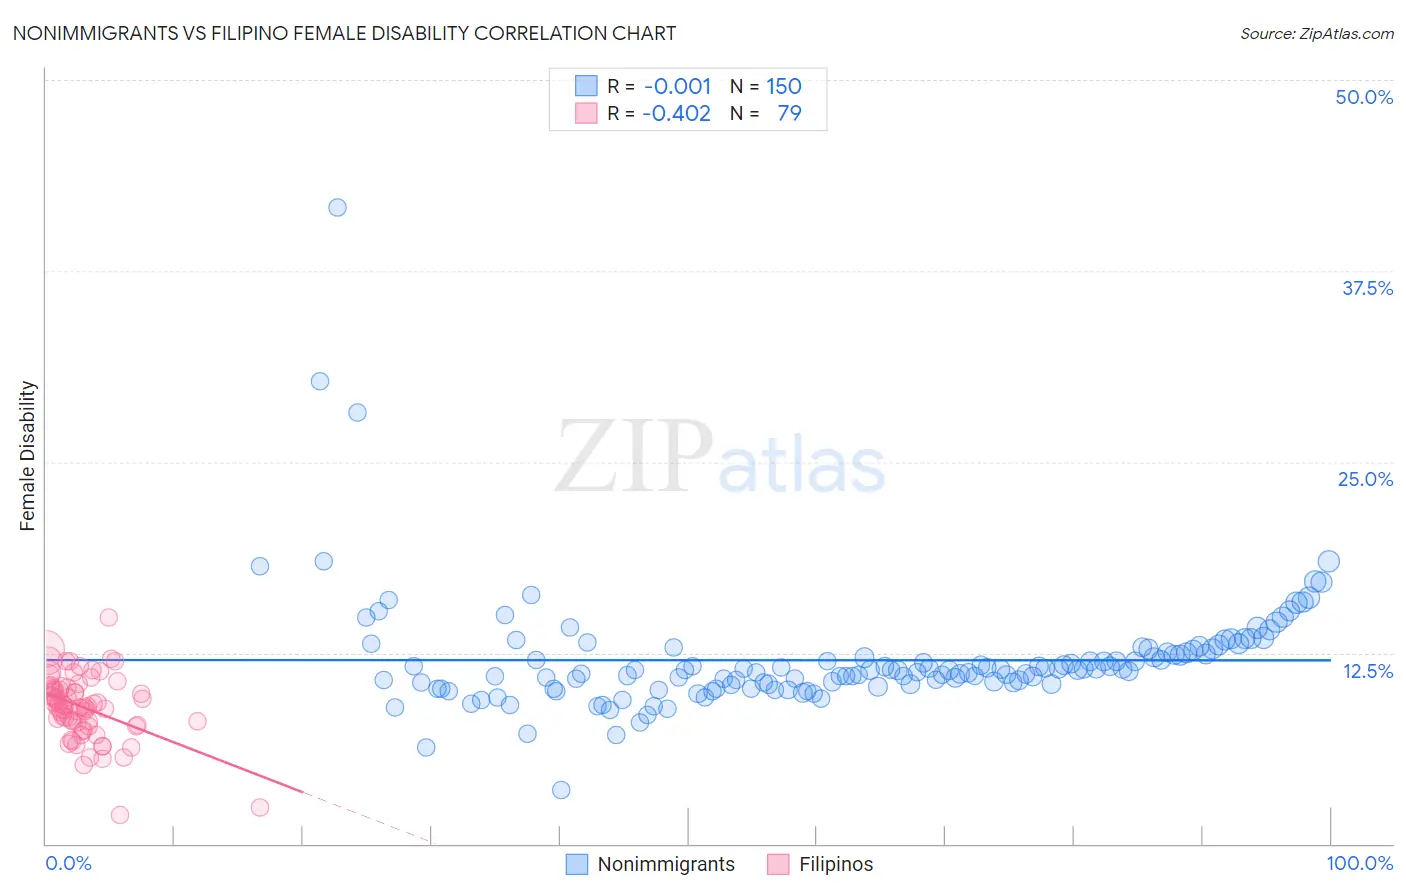
Nonimmigrants vs Filipino Female Disability Correlation Chart
The statistical analysis conducted on geographies consisting of 584,611,893 people shows no correlation between the proportion of Nonimmigrants and percentage of females with a disability in the United States with a correlation coefficient (R) of -0.001 and weighted average of 13.4%. Similarly, the statistical analysis conducted on geographies consisting of 254,340,096 people shows a moderate negative correlation between the proportion of Filipinos and percentage of females with a disability in the United States with a correlation coefficient (R) of -0.402 and weighted average of 10.1%, a difference of 32.8%.
Female Disability Correlation Summary
| Measurement | Nonimmigrants | Filipino |
| Minimum | 3.5% | 1.9% |
| Maximum | 41.7% | 14.8% |
| Range | 38.2% | 13.0% |
| Mean | 12.0% | 8.9% |
| Median | 11.4% | 9.0% |
| Interquartile 25% (IQ1) | 10.4% | 7.8% |
| Interquartile 75% (IQ3) | 12.7% | 10.3% |
| Interquartile Range (IQR) | 2.2% | 2.5% |
| Standard Deviation (Sample) | 3.9% | 2.2% |
| Standard Deviation (Population) | 3.8% | 2.1% |
Similar Demographics by Female Disability
Demographics Similar to Nonimmigrants by Female Disability
In terms of female disability, the demographic groups most similar to Nonimmigrants are Immigrants from Dominican Republic (13.4%, a difference of 0.26%), Pennsylvania German (13.4%, a difference of 0.27%), Slovak (13.3%, a difference of 0.30%), Nepalese (13.3%, a difference of 0.34%), and French (13.3%, a difference of 0.47%).
| Demographics | Rating | Rank | Female Disability |
| Shoshone | 0.0 /100 | #291 | Tragic 13.2% |
| Yakama | 0.0 /100 | #292 | Tragic 13.2% |
| Marshallese | 0.0 /100 | #293 | Tragic 13.3% |
| Celtics | 0.0 /100 | #294 | Tragic 13.3% |
| French | 0.0 /100 | #295 | Tragic 13.3% |
| Nepalese | 0.0 /100 | #296 | Tragic 13.3% |
| Slovaks | 0.0 /100 | #297 | Tragic 13.3% |
| Immigrants | Nonimmigrants | 0.0 /100 | #298 | Tragic 13.4% |
| Immigrants | Dominican Republic | 0.0 /100 | #299 | Tragic 13.4% |
| Pennsylvania Germans | 0.0 /100 | #300 | Tragic 13.4% |
| Africans | 0.0 /100 | #301 | Tragic 13.4% |
| Scotch-Irish | 0.0 /100 | #302 | Tragic 13.4% |
| Immigrants | Portugal | 0.0 /100 | #303 | Tragic 13.5% |
| Immigrants | Micronesia | 0.0 /100 | #304 | Tragic 13.5% |
| Dominicans | 0.0 /100 | #305 | Tragic 13.5% |
Demographics Similar to Filipinos by Female Disability
In terms of female disability, the demographic groups most similar to Filipinos are Immigrants from Taiwan (10.1%, a difference of 0.23%), Immigrants from India (10.0%, a difference of 0.93%), Thai (10.2%, a difference of 1.1%), Immigrants from Bolivia (10.3%, a difference of 1.9%), and Bolivian (10.4%, a difference of 2.9%).
| Demographics | Rating | Rank | Female Disability |
| Immigrants | India | 100.0 /100 | #1 | Exceptional 10.0% |
| Filipinos | 100.0 /100 | #2 | Exceptional 10.1% |
| Immigrants | Taiwan | 100.0 /100 | #3 | Exceptional 10.1% |
| Thais | 100.0 /100 | #4 | Exceptional 10.2% |
| Immigrants | Bolivia | 100.0 /100 | #5 | Exceptional 10.3% |
| Bolivians | 100.0 /100 | #6 | Exceptional 10.4% |
| Immigrants | Singapore | 100.0 /100 | #7 | Exceptional 10.4% |
| Immigrants | South Central Asia | 100.0 /100 | #8 | Exceptional 10.5% |
| Iranians | 100.0 /100 | #9 | Exceptional 10.6% |
| Immigrants | Hong Kong | 100.0 /100 | #10 | Exceptional 10.6% |
| Immigrants | Korea | 100.0 /100 | #11 | Exceptional 10.6% |
| Immigrants | Israel | 100.0 /100 | #12 | Exceptional 10.7% |
| Immigrants | Eastern Asia | 100.0 /100 | #13 | Exceptional 10.7% |
| Immigrants | China | 100.0 /100 | #14 | Exceptional 10.7% |
| Burmese | 100.0 /100 | #15 | Exceptional 10.7% |