Nonimmigrants vs Apache Unemployment Among Ages 30 to 34 years
COMPARE
Nonimmigrants
Apache
Unemployment Among Ages 30 to 34 years
Unemployment Among Ages 30 to 34 years Comparison
Nonimmigrants
Apache
6.1%
UNEMPLOYMENT AMONG AGES 30 TO 34 YEARS
0.2/ 100
METRIC RATING
253rd/ 347
METRIC RANK
7.3%
UNEMPLOYMENT AMONG AGES 30 TO 34 YEARS
0.0/ 100
METRIC RATING
325th/ 347
METRIC RANK
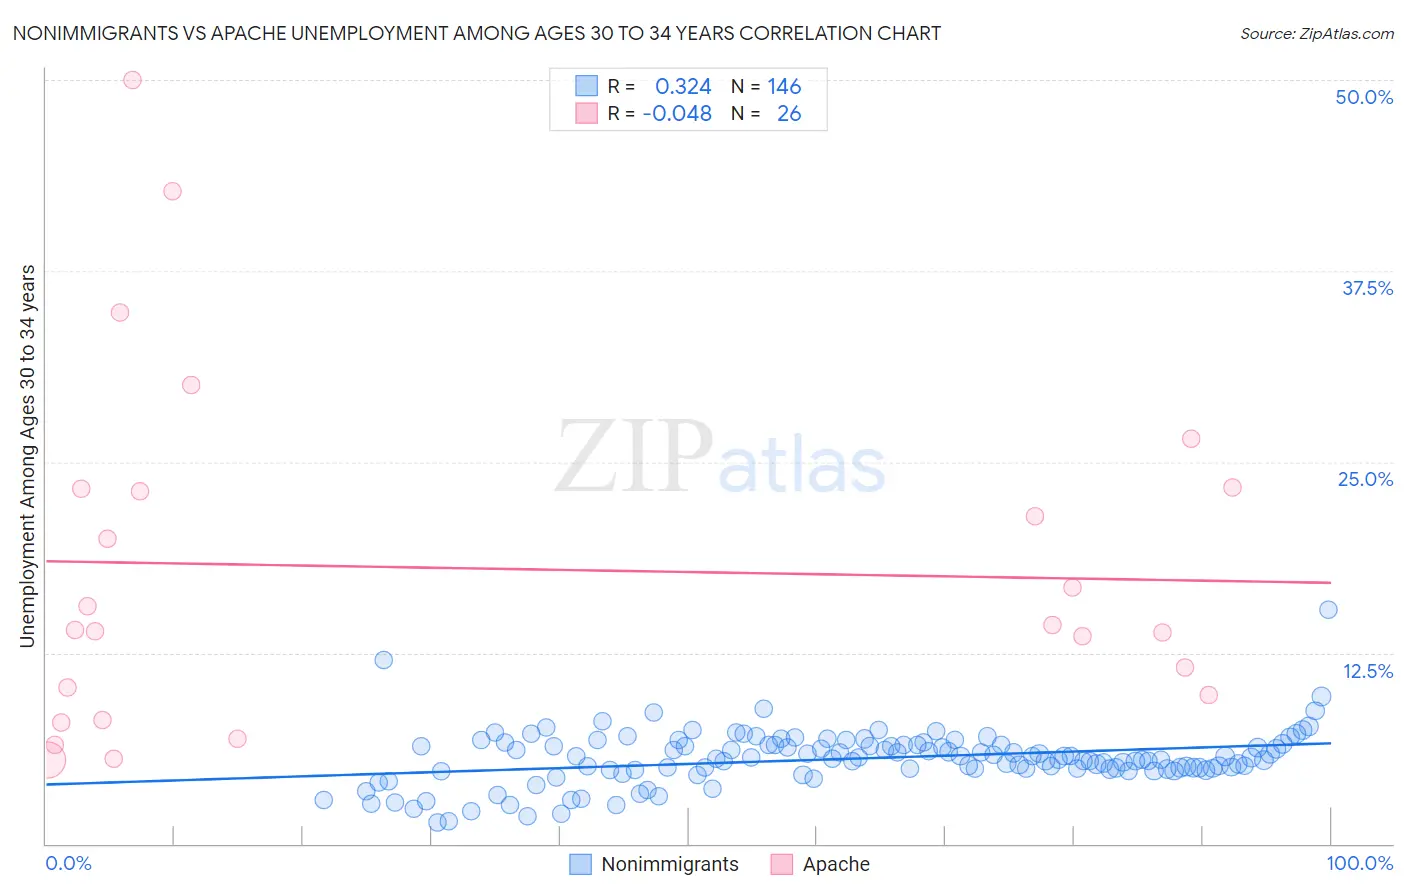
Nonimmigrants vs Apache Unemployment Among Ages 30 to 34 years Correlation Chart
The statistical analysis conducted on geographies consisting of 505,242,058 people shows a mild positive correlation between the proportion of Nonimmigrants and unemployment rate among population between the ages 30 and 34 in the United States with a correlation coefficient (R) of 0.324 and weighted average of 6.1%. Similarly, the statistical analysis conducted on geographies consisting of 223,147,078 people shows no correlation between the proportion of Apache and unemployment rate among population between the ages 30 and 34 in the United States with a correlation coefficient (R) of -0.048 and weighted average of 7.3%, a difference of 21.2%.
Unemployment Among Ages 30 to 34 years Correlation Summary
| Measurement | Nonimmigrants | Apache |
| Minimum | 1.4% | 5.5% |
| Maximum | 15.3% | 50.0% |
| Range | 13.9% | 44.5% |
| Mean | 5.6% | 18.0% |
| Median | 5.6% | 14.1% |
| Interquartile 25% (IQ1) | 4.9% | 9.7% |
| Interquartile 75% (IQ3) | 6.5% | 23.3% |
| Interquartile Range (IQR) | 1.6% | 13.6% |
| Standard Deviation (Sample) | 1.8% | 11.4% |
| Standard Deviation (Population) | 1.8% | 11.2% |
Similar Demographics by Unemployment Among Ages 30 to 34 years
Demographics Similar to Nonimmigrants by Unemployment Among Ages 30 to 34 years
In terms of unemployment among ages 30 to 34 years, the demographic groups most similar to Nonimmigrants are Potawatomi (6.0%, a difference of 0.34%), Tlingit-Haida (6.0%, a difference of 0.36%), Immigrants from Honduras (6.0%, a difference of 0.55%), Armenian (6.1%, a difference of 0.63%), and Immigrants from Guatemala (6.0%, a difference of 0.65%).
| Demographics | Rating | Rank | Unemployment Among Ages 30 to 34 years |
| Ghanaians | 0.3 /100 | #246 | Tragic 6.0% |
| Nigerians | 0.3 /100 | #247 | Tragic 6.0% |
| Immigrants | Guatemala | 0.3 /100 | #248 | Tragic 6.0% |
| Hondurans | 0.3 /100 | #249 | Tragic 6.0% |
| Immigrants | Honduras | 0.3 /100 | #250 | Tragic 6.0% |
| Tlingit-Haida | 0.2 /100 | #251 | Tragic 6.0% |
| Potawatomi | 0.2 /100 | #252 | Tragic 6.0% |
| Immigrants | Nonimmigrants | 0.2 /100 | #253 | Tragic 6.1% |
| Armenians | 0.1 /100 | #254 | Tragic 6.1% |
| Immigrants | Portugal | 0.1 /100 | #255 | Tragic 6.1% |
| Immigrants | Ghana | 0.1 /100 | #256 | Tragic 6.1% |
| Immigrants | Sierra Leone | 0.1 /100 | #257 | Tragic 6.1% |
| Mexicans | 0.1 /100 | #258 | Tragic 6.1% |
| Haitians | 0.1 /100 | #259 | Tragic 6.1% |
| Immigrants | Latin America | 0.1 /100 | #260 | Tragic 6.1% |
Demographics Similar to Apache by Unemployment Among Ages 30 to 34 years
In terms of unemployment among ages 30 to 34 years, the demographic groups most similar to Apache are Immigrants from Dominica (7.3%, a difference of 0.28%), Immigrants from Yemen (7.3%, a difference of 0.86%), Marshallese (7.2%, a difference of 1.3%), Immigrants from Guyana (7.2%, a difference of 1.8%), and Cape Verdean (7.2%, a difference of 2.1%).
| Demographics | Rating | Rank | Unemployment Among Ages 30 to 34 years |
| Blacks/African Americans | 0.0 /100 | #318 | Tragic 7.2% |
| Guyanese | 0.0 /100 | #319 | Tragic 7.2% |
| Cape Verdeans | 0.0 /100 | #320 | Tragic 7.2% |
| Immigrants | Guyana | 0.0 /100 | #321 | Tragic 7.2% |
| Marshallese | 0.0 /100 | #322 | Tragic 7.2% |
| Immigrants | Yemen | 0.0 /100 | #323 | Tragic 7.3% |
| Immigrants | Dominica | 0.0 /100 | #324 | Tragic 7.3% |
| Apache | 0.0 /100 | #325 | Tragic 7.3% |
| Dominicans | 0.0 /100 | #326 | Tragic 7.7% |
| Immigrants | Dominican Republic | 0.0 /100 | #327 | Tragic 7.7% |
| Chippewa | 0.0 /100 | #328 | Tragic 7.8% |
| Cheyenne | 0.0 /100 | #329 | Tragic 7.8% |
| Shoshone | 0.0 /100 | #330 | Tragic 7.9% |
| Sioux | 0.0 /100 | #331 | Tragic 8.0% |
| Natives/Alaskans | 0.0 /100 | #332 | Tragic 8.2% |