Cree vs Apache Female Disability
COMPARE
Cree
Apache
Female Disability
Female Disability Comparison
Cree
Apache
13.7%
FEMALE DISABILITY
0.0/ 100
METRIC RATING
308th/ 347
METRIC RANK
13.7%
FEMALE DISABILITY
0.0/ 100
METRIC RATING
310th/ 347
METRIC RANK
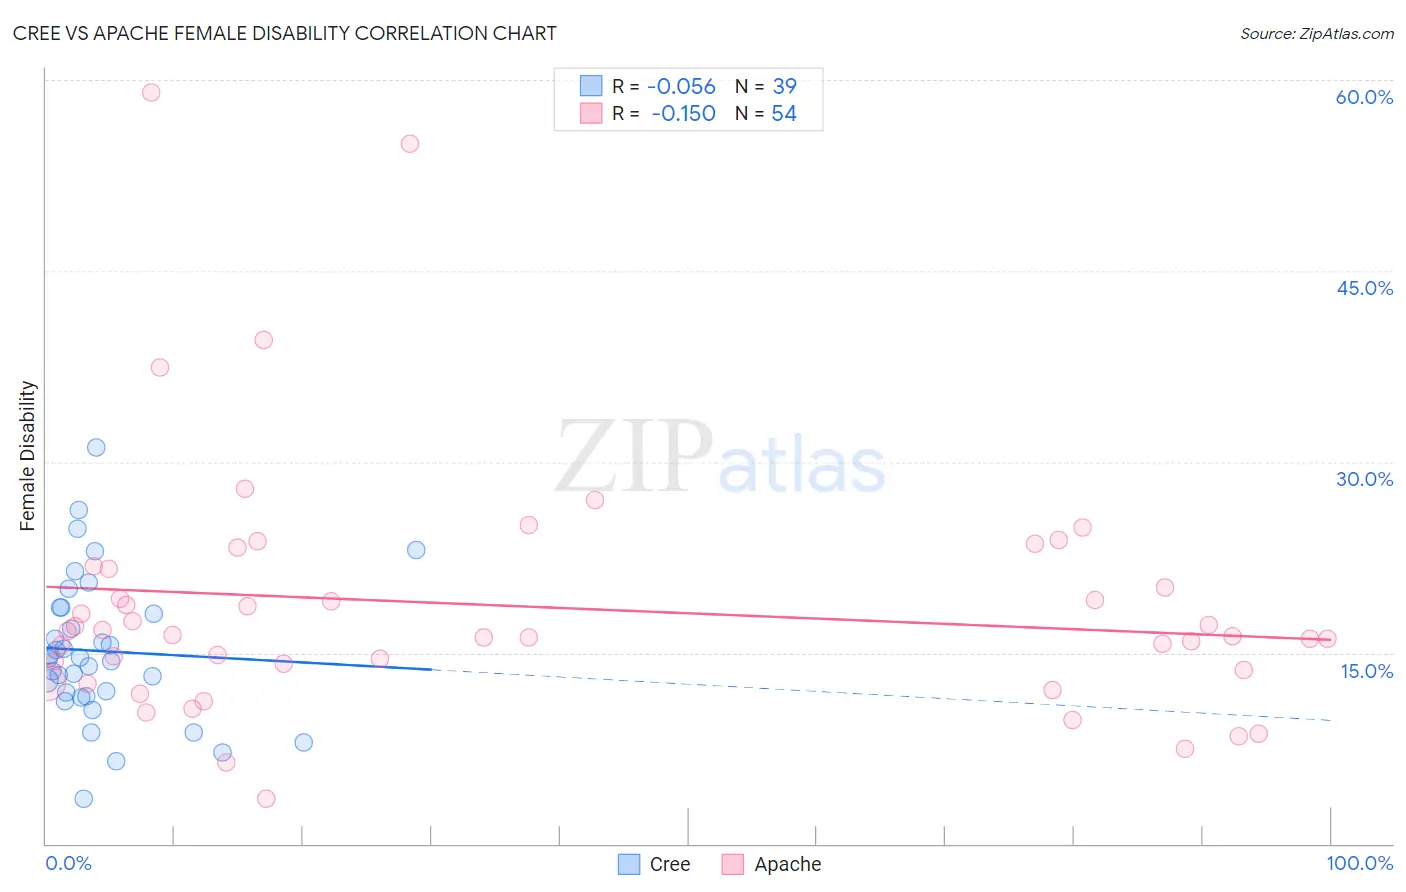
Cree vs Apache Female Disability Correlation Chart
The statistical analysis conducted on geographies consisting of 76,204,869 people shows a slight negative correlation between the proportion of Cree and percentage of females with a disability in the United States with a correlation coefficient (R) of -0.056 and weighted average of 13.7%. Similarly, the statistical analysis conducted on geographies consisting of 231,061,138 people shows a poor negative correlation between the proportion of Apache and percentage of females with a disability in the United States with a correlation coefficient (R) of -0.150 and weighted average of 13.7%, a difference of 0.18%.
Female Disability Correlation Summary
| Measurement | Cree | Apache |
| Minimum | 3.6% | 3.6% |
| Maximum | 31.2% | 59.0% |
| Range | 27.6% | 55.5% |
| Mean | 15.1% | 18.7% |
| Median | 14.6% | 16.3% |
| Interquartile 25% (IQ1) | 11.6% | 13.7% |
| Interquartile 75% (IQ3) | 18.6% | 21.6% |
| Interquartile Range (IQR) | 7.0% | 7.9% |
| Standard Deviation (Sample) | 5.7% | 10.1% |
| Standard Deviation (Population) | 5.6% | 10.0% |
Demographics Similar to Cree and Apache by Female Disability
In terms of female disability, the demographic groups most similar to Cree are French American Indian (13.7%, a difference of 0.060%), Central American Indian (13.6%, a difference of 0.46%), Hopi (13.7%, a difference of 0.46%), French Canadian (13.6%, a difference of 0.75%), and Delaware (13.8%, a difference of 0.77%). Similarly, the demographic groups most similar to Apache are French American Indian (13.7%, a difference of 0.12%), Hopi (13.7%, a difference of 0.29%), Delaware (13.8%, a difference of 0.60%), Central American Indian (13.6%, a difference of 0.63%), and Blackfeet (13.8%, a difference of 0.91%).
| Demographics | Rating | Rank | Female Disability |
| Immigrants | Dominican Republic | 0.0 /100 | #299 | Tragic 13.4% |
| Pennsylvania Germans | 0.0 /100 | #300 | Tragic 13.4% |
| Africans | 0.0 /100 | #301 | Tragic 13.4% |
| Scotch-Irish | 0.0 /100 | #302 | Tragic 13.4% |
| Immigrants | Portugal | 0.0 /100 | #303 | Tragic 13.5% |
| Immigrants | Micronesia | 0.0 /100 | #304 | Tragic 13.5% |
| Dominicans | 0.0 /100 | #305 | Tragic 13.5% |
| French Canadians | 0.0 /100 | #306 | Tragic 13.6% |
| Central American Indians | 0.0 /100 | #307 | Tragic 13.6% |
| Cree | 0.0 /100 | #308 | Tragic 13.7% |
| French American Indians | 0.0 /100 | #309 | Tragic 13.7% |
| Apache | 0.0 /100 | #310 | Tragic 13.7% |
| Hopi | 0.0 /100 | #311 | Tragic 13.7% |
| Delaware | 0.0 /100 | #312 | Tragic 13.8% |
| Blackfeet | 0.0 /100 | #313 | Tragic 13.8% |
| Puget Sound Salish | 0.0 /100 | #314 | Tragic 13.8% |
| Alaskan Athabascans | 0.0 /100 | #315 | Tragic 13.9% |
| Spanish Americans | 0.0 /100 | #316 | Tragic 14.0% |
| Chippewa | 0.0 /100 | #317 | Tragic 14.0% |
| Paiute | 0.0 /100 | #318 | Tragic 14.0% |
| Iroquois | 0.0 /100 | #319 | Tragic 14.0% |