Nonimmigrants vs Israeli Female Disability
COMPARE
Nonimmigrants
Israeli
Female Disability
Female Disability Comparison
Nonimmigrants
Israelis
13.4%
FEMALE DISABILITY
0.0/ 100
METRIC RATING
298th/ 347
METRIC RANK
11.2%
FEMALE DISABILITY
100.0/ 100
METRIC RATING
42nd/ 347
METRIC RANK
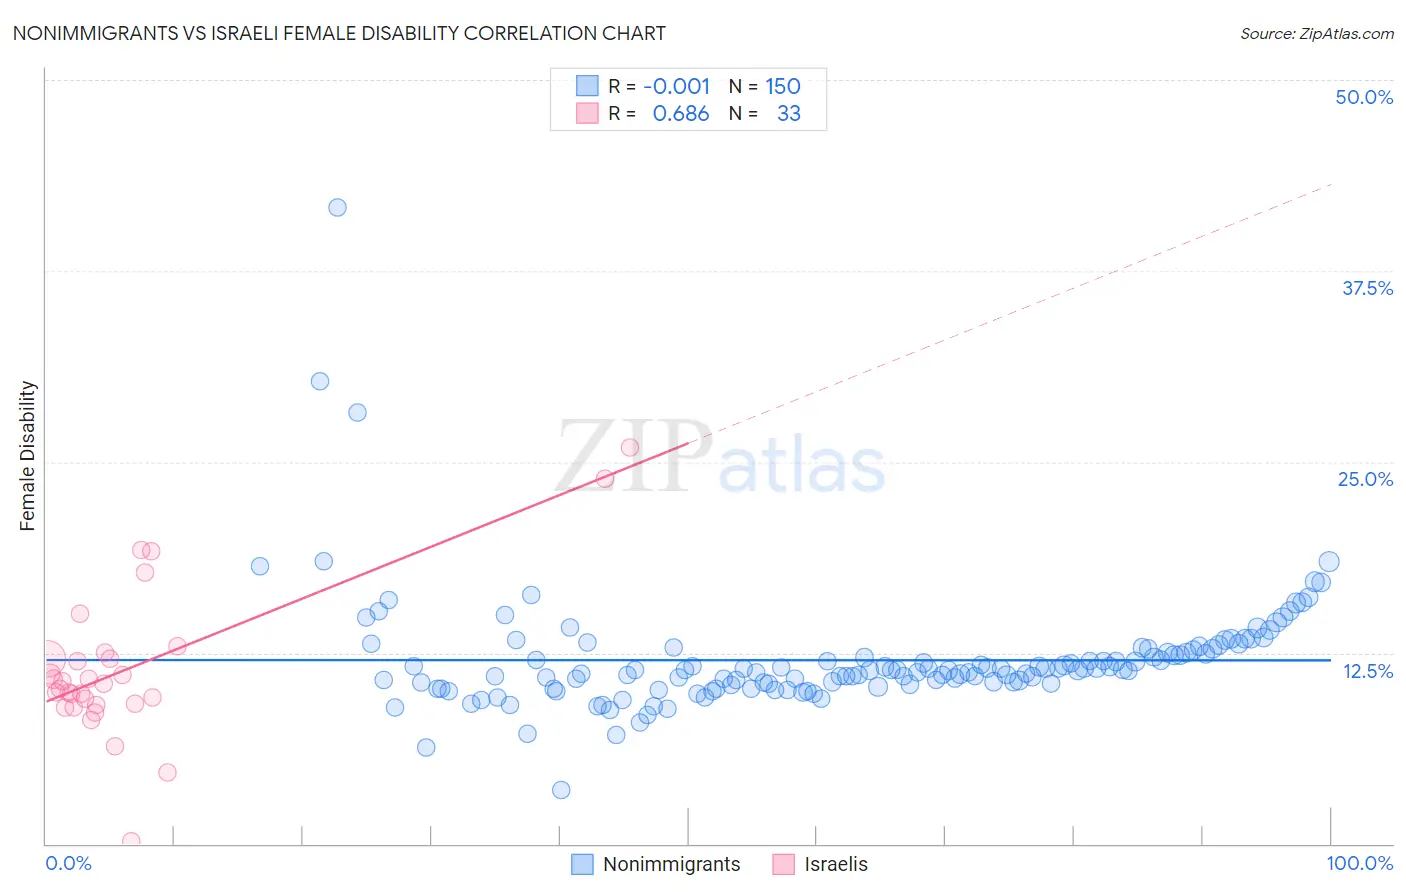
Nonimmigrants vs Israeli Female Disability Correlation Chart
The statistical analysis conducted on geographies consisting of 584,611,893 people shows no correlation between the proportion of Nonimmigrants and percentage of females with a disability in the United States with a correlation coefficient (R) of -0.001 and weighted average of 13.4%. Similarly, the statistical analysis conducted on geographies consisting of 211,173,315 people shows a significant positive correlation between the proportion of Israelis and percentage of females with a disability in the United States with a correlation coefficient (R) of 0.686 and weighted average of 11.2%, a difference of 19.0%.
Female Disability Correlation Summary
| Measurement | Nonimmigrants | Israeli |
| Minimum | 3.5% | 0.17% |
| Maximum | 41.7% | 25.9% |
| Range | 38.2% | 25.8% |
| Mean | 12.0% | 11.5% |
| Median | 11.4% | 10.5% |
| Interquartile 25% (IQ1) | 10.4% | 9.1% |
| Interquartile 75% (IQ3) | 12.7% | 12.3% |
| Interquartile Range (IQR) | 2.2% | 3.2% |
| Standard Deviation (Sample) | 3.9% | 5.0% |
| Standard Deviation (Population) | 3.8% | 4.9% |
Similar Demographics by Female Disability
Demographics Similar to Nonimmigrants by Female Disability
In terms of female disability, the demographic groups most similar to Nonimmigrants are Immigrants from Dominican Republic (13.4%, a difference of 0.26%), Pennsylvania German (13.4%, a difference of 0.27%), Slovak (13.3%, a difference of 0.30%), Nepalese (13.3%, a difference of 0.34%), and French (13.3%, a difference of 0.47%).
| Demographics | Rating | Rank | Female Disability |
| Shoshone | 0.0 /100 | #291 | Tragic 13.2% |
| Yakama | 0.0 /100 | #292 | Tragic 13.2% |
| Marshallese | 0.0 /100 | #293 | Tragic 13.3% |
| Celtics | 0.0 /100 | #294 | Tragic 13.3% |
| French | 0.0 /100 | #295 | Tragic 13.3% |
| Nepalese | 0.0 /100 | #296 | Tragic 13.3% |
| Slovaks | 0.0 /100 | #297 | Tragic 13.3% |
| Immigrants | Nonimmigrants | 0.0 /100 | #298 | Tragic 13.4% |
| Immigrants | Dominican Republic | 0.0 /100 | #299 | Tragic 13.4% |
| Pennsylvania Germans | 0.0 /100 | #300 | Tragic 13.4% |
| Africans | 0.0 /100 | #301 | Tragic 13.4% |
| Scotch-Irish | 0.0 /100 | #302 | Tragic 13.4% |
| Immigrants | Portugal | 0.0 /100 | #303 | Tragic 13.5% |
| Immigrants | Micronesia | 0.0 /100 | #304 | Tragic 13.5% |
| Dominicans | 0.0 /100 | #305 | Tragic 13.5% |
Demographics Similar to Israelis by Female Disability
In terms of female disability, the demographic groups most similar to Israelis are Afghan (11.2%, a difference of 0.030%), Paraguayan (11.2%, a difference of 0.10%), Mongolian (11.2%, a difference of 0.11%), Immigrants from Lithuania (11.2%, a difference of 0.15%), and Cambodian (11.3%, a difference of 0.22%).
| Demographics | Rating | Rank | Female Disability |
| Immigrants | Japan | 100.0 /100 | #35 | Exceptional 11.2% |
| Cypriots | 100.0 /100 | #36 | Exceptional 11.2% |
| Ethiopians | 100.0 /100 | #37 | Exceptional 11.2% |
| Immigrants | Ethiopia | 100.0 /100 | #38 | Exceptional 11.2% |
| Immigrants | Lithuania | 100.0 /100 | #39 | Exceptional 11.2% |
| Mongolians | 100.0 /100 | #40 | Exceptional 11.2% |
| Paraguayans | 100.0 /100 | #41 | Exceptional 11.2% |
| Israelis | 100.0 /100 | #42 | Exceptional 11.2% |
| Afghans | 100.0 /100 | #43 | Exceptional 11.2% |
| Cambodians | 100.0 /100 | #44 | Exceptional 11.3% |
| Immigrants | Sweden | 100.0 /100 | #45 | Exceptional 11.3% |
| Immigrants | Nepal | 100.0 /100 | #46 | Exceptional 11.3% |
| Jordanians | 100.0 /100 | #47 | Exceptional 11.3% |
| Zimbabweans | 100.0 /100 | #48 | Exceptional 11.3% |
| Tongans | 100.0 /100 | #49 | Exceptional 11.3% |