Nonimmigrants vs Cajun Female Disability
COMPARE
Nonimmigrants
Cajun
Female Disability
Female Disability Comparison
Nonimmigrants
Cajuns
13.4%
FEMALE DISABILITY
0.0/ 100
METRIC RATING
298th/ 347
METRIC RANK
14.9%
FEMALE DISABILITY
0.0/ 100
METRIC RATING
335th/ 347
METRIC RANK
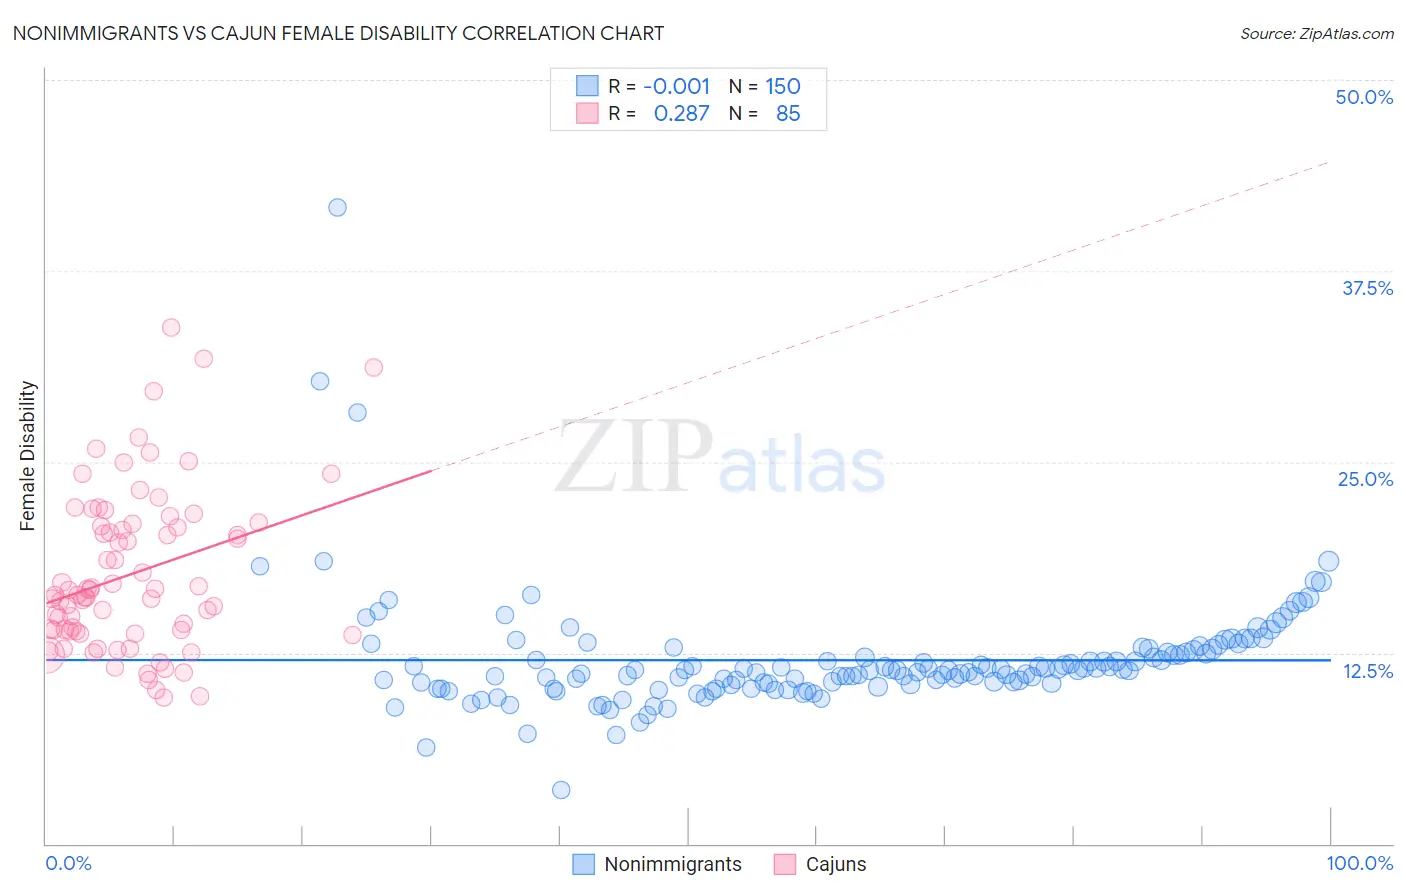
Nonimmigrants vs Cajun Female Disability Correlation Chart
The statistical analysis conducted on geographies consisting of 584,611,893 people shows no correlation between the proportion of Nonimmigrants and percentage of females with a disability in the United States with a correlation coefficient (R) of -0.001 and weighted average of 13.4%. Similarly, the statistical analysis conducted on geographies consisting of 149,701,485 people shows a weak positive correlation between the proportion of Cajuns and percentage of females with a disability in the United States with a correlation coefficient (R) of 0.287 and weighted average of 14.9%, a difference of 11.2%.
Female Disability Correlation Summary
| Measurement | Nonimmigrants | Cajun |
| Minimum | 3.5% | 9.6% |
| Maximum | 41.7% | 33.8% |
| Range | 38.2% | 24.2% |
| Mean | 12.0% | 17.7% |
| Median | 11.4% | 16.3% |
| Interquartile 25% (IQ1) | 10.4% | 13.9% |
| Interquartile 75% (IQ3) | 12.7% | 20.9% |
| Interquartile Range (IQR) | 2.2% | 7.0% |
| Standard Deviation (Sample) | 3.9% | 5.2% |
| Standard Deviation (Population) | 3.8% | 5.2% |
Similar Demographics by Female Disability
Demographics Similar to Nonimmigrants by Female Disability
In terms of female disability, the demographic groups most similar to Nonimmigrants are Immigrants from Dominican Republic (13.4%, a difference of 0.26%), Pennsylvania German (13.4%, a difference of 0.27%), Slovak (13.3%, a difference of 0.30%), Nepalese (13.3%, a difference of 0.34%), and French (13.3%, a difference of 0.47%).
| Demographics | Rating | Rank | Female Disability |
| Shoshone | 0.0 /100 | #291 | Tragic 13.2% |
| Yakama | 0.0 /100 | #292 | Tragic 13.2% |
| Marshallese | 0.0 /100 | #293 | Tragic 13.3% |
| Celtics | 0.0 /100 | #294 | Tragic 13.3% |
| French | 0.0 /100 | #295 | Tragic 13.3% |
| Nepalese | 0.0 /100 | #296 | Tragic 13.3% |
| Slovaks | 0.0 /100 | #297 | Tragic 13.3% |
| Immigrants | Nonimmigrants | 0.0 /100 | #298 | Tragic 13.4% |
| Immigrants | Dominican Republic | 0.0 /100 | #299 | Tragic 13.4% |
| Pennsylvania Germans | 0.0 /100 | #300 | Tragic 13.4% |
| Africans | 0.0 /100 | #301 | Tragic 13.4% |
| Scotch-Irish | 0.0 /100 | #302 | Tragic 13.4% |
| Immigrants | Portugal | 0.0 /100 | #303 | Tragic 13.5% |
| Immigrants | Micronesia | 0.0 /100 | #304 | Tragic 13.5% |
| Dominicans | 0.0 /100 | #305 | Tragic 13.5% |
Demographics Similar to Cajuns by Female Disability
In terms of female disability, the demographic groups most similar to Cajuns are Cherokee (14.9%, a difference of 0.020%), Immigrants from the Azores (14.9%, a difference of 0.11%), Pima (14.8%, a difference of 0.50%), Seminole (15.0%, a difference of 0.67%), and Tohono O'odham (15.0%, a difference of 0.80%).
| Demographics | Rating | Rank | Female Disability |
| Cape Verdeans | 0.0 /100 | #328 | Tragic 14.2% |
| Osage | 0.0 /100 | #329 | Tragic 14.3% |
| Yuman | 0.0 /100 | #330 | Tragic 14.5% |
| Immigrants | Cabo Verde | 0.0 /100 | #331 | Tragic 14.6% |
| Pima | 0.0 /100 | #332 | Tragic 14.8% |
| Immigrants | Azores | 0.0 /100 | #333 | Tragic 14.9% |
| Cherokee | 0.0 /100 | #334 | Tragic 14.9% |
| Cajuns | 0.0 /100 | #335 | Tragic 14.9% |
| Seminole | 0.0 /100 | #336 | Tragic 15.0% |
| Tohono O'odham | 0.0 /100 | #337 | Tragic 15.0% |
| Dutch West Indians | 0.0 /100 | #338 | Tragic 15.0% |
| Colville | 0.0 /100 | #339 | Tragic 15.1% |
| Chickasaw | 0.0 /100 | #340 | Tragic 15.2% |
| Choctaw | 0.0 /100 | #341 | Tragic 15.4% |
| Creek | 0.0 /100 | #342 | Tragic 15.7% |