Nigerian vs South African In Labor Force | Age 16-19
COMPARE
Nigerian
South African
In Labor Force | Age 16-19
In Labor Force | Age 16-19 Comparison
Nigerians
South Africans
36.1%
IN LABOR FORCE | AGE 16-19
24.6/ 100
METRIC RATING
194th/ 347
METRIC RANK
36.7%
IN LABOR FORCE | AGE 16-19
58.3/ 100
METRIC RATING
172nd/ 347
METRIC RANK
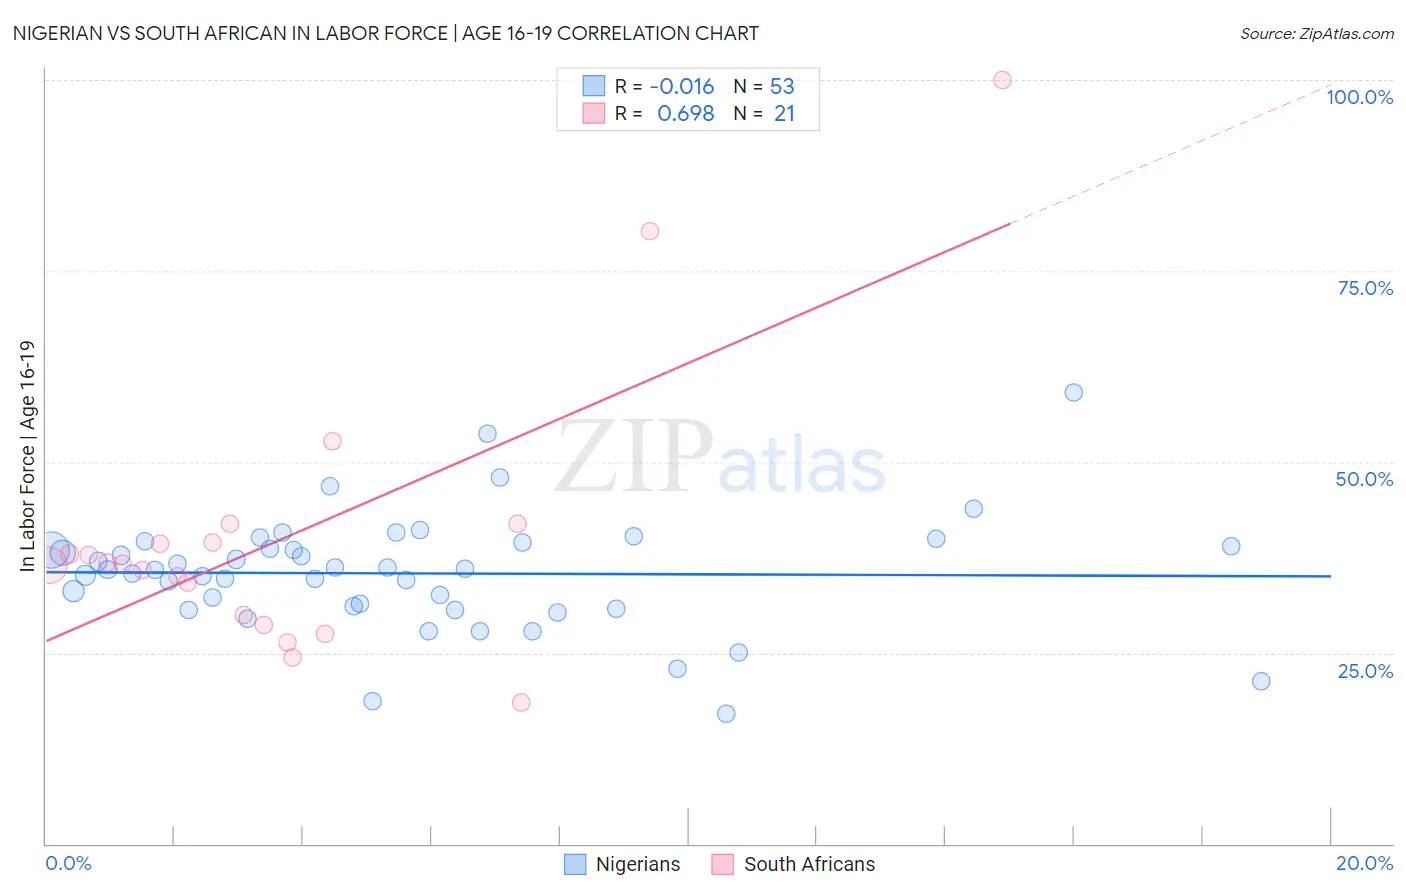
Nigerian vs South African In Labor Force | Age 16-19 Correlation Chart
The statistical analysis conducted on geographies consisting of 332,555,349 people shows no correlation between the proportion of Nigerians and labor force participation rate among population between the ages 16 and 19 in the United States with a correlation coefficient (R) of -0.016 and weighted average of 36.1%. Similarly, the statistical analysis conducted on geographies consisting of 182,382,145 people shows a significant positive correlation between the proportion of South Africans and labor force participation rate among population between the ages 16 and 19 in the United States with a correlation coefficient (R) of 0.698 and weighted average of 36.7%, a difference of 1.8%.
In Labor Force | Age 16-19 Correlation Summary
| Measurement | Nigerian | South African |
| Minimum | 17.0% | 18.5% |
| Maximum | 59.1% | 100.0% |
| Range | 42.1% | 81.5% |
| Mean | 35.4% | 40.1% |
| Median | 35.9% | 36.7% |
| Interquartile 25% (IQ1) | 31.0% | 29.3% |
| Interquartile 75% (IQ3) | 39.2% | 40.7% |
| Interquartile Range (IQR) | 8.2% | 11.4% |
| Standard Deviation (Sample) | 7.5% | 18.4% |
| Standard Deviation (Population) | 7.5% | 18.0% |
Similar Demographics by In Labor Force | Age 16-19
Demographics Similar to Nigerians by In Labor Force | Age 16-19
In terms of in labor force | age 16-19, the demographic groups most similar to Nigerians are Immigrants from Denmark (36.1%, a difference of 0.030%), Afghan (36.1%, a difference of 0.070%), Bolivian (36.0%, a difference of 0.090%), Immigrants from Croatia (36.1%, a difference of 0.19%), and Panamanian (36.1%, a difference of 0.26%).
| Demographics | Rating | Rank | In Labor Force | Age 16-19 |
| Immigrants | Afghanistan | 34.0 /100 | #187 | Fair 36.3% |
| Immigrants | Europe | 31.8 /100 | #188 | Fair 36.2% |
| Immigrants | Hungary | 28.8 /100 | #189 | Fair 36.2% |
| Panamanians | 28.6 /100 | #190 | Fair 36.1% |
| Immigrants | Croatia | 27.5 /100 | #191 | Fair 36.1% |
| Afghans | 25.7 /100 | #192 | Fair 36.1% |
| Immigrants | Denmark | 25.0 /100 | #193 | Fair 36.1% |
| Nigerians | 24.6 /100 | #194 | Fair 36.1% |
| Bolivians | 23.3 /100 | #195 | Fair 36.0% |
| Mexican American Indians | 21.1 /100 | #196 | Fair 36.0% |
| Immigrants | Serbia | 21.0 /100 | #197 | Fair 36.0% |
| Immigrants | Northern Africa | 19.9 /100 | #198 | Poor 35.9% |
| Immigrants | Norway | 19.8 /100 | #199 | Poor 35.9% |
| Immigrants | Sweden | 18.8 /100 | #200 | Poor 35.9% |
| Alsatians | 17.5 /100 | #201 | Poor 35.9% |
Demographics Similar to South Africans by In Labor Force | Age 16-19
In terms of in labor force | age 16-19, the demographic groups most similar to South Africans are Immigrants from Cambodia (36.7%, a difference of 0.010%), Russian (36.7%, a difference of 0.040%), Immigrants from South Africa (36.8%, a difference of 0.11%), Immigrants from Latvia (36.8%, a difference of 0.17%), and Palestinian (36.8%, a difference of 0.25%).
| Demographics | Rating | Rank | In Labor Force | Age 16-19 |
| Yakama | 66.9 /100 | #165 | Good 36.9% |
| Immigrants | Western Africa | 66.7 /100 | #166 | Good 36.9% |
| Arabs | 63.6 /100 | #167 | Good 36.8% |
| Palestinians | 63.1 /100 | #168 | Good 36.8% |
| Immigrants | Latvia | 61.6 /100 | #169 | Good 36.8% |
| Immigrants | South Africa | 60.5 /100 | #170 | Good 36.8% |
| Immigrants | Cambodia | 58.4 /100 | #171 | Average 36.7% |
| South Africans | 58.3 /100 | #172 | Average 36.7% |
| Russians | 57.5 /100 | #173 | Average 36.7% |
| Immigrants | Czechoslovakia | 50.0 /100 | #174 | Average 36.6% |
| Natives/Alaskans | 49.0 /100 | #175 | Average 36.6% |
| Albanians | 48.8 /100 | #176 | Average 36.5% |
| Immigrants | Northern Europe | 46.6 /100 | #177 | Average 36.5% |
| Blacks/African Americans | 45.1 /100 | #178 | Average 36.5% |
| Immigrants | Southern Europe | 43.3 /100 | #179 | Average 36.4% |