Irish vs Immigrants from Thailand Hearing Disability
COMPARE
Irish
Immigrants from Thailand
Hearing Disability
Hearing Disability Comparison
Irish
Immigrants from Thailand
3.7%
HEARING DISABILITY
0.0/ 100
METRIC RATING
288th/ 347
METRIC RANK
3.1%
HEARING DISABILITY
16.4/ 100
METRIC RATING
202nd/ 347
METRIC RANK
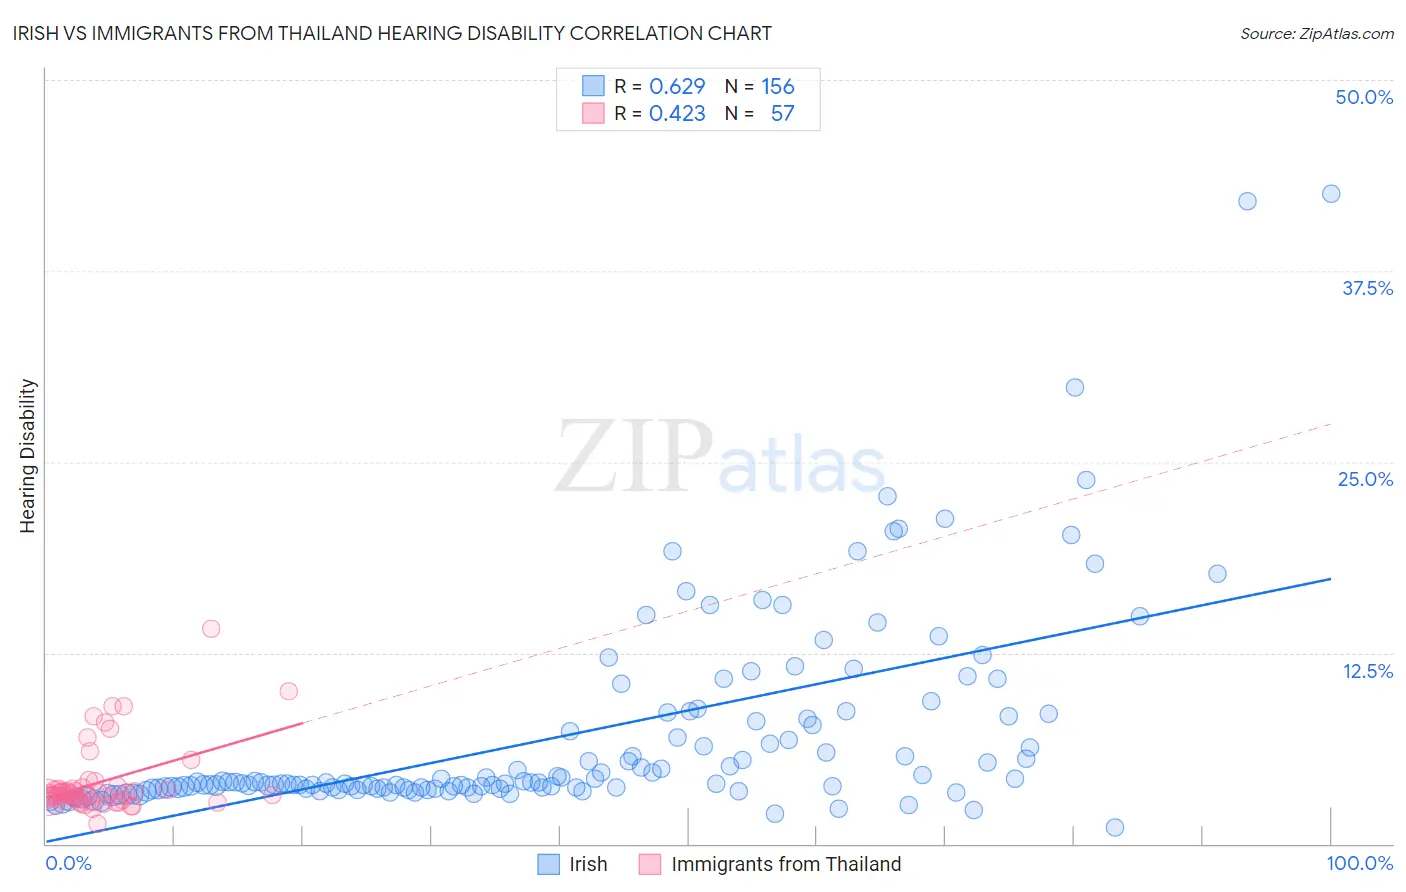
Irish vs Immigrants from Thailand Hearing Disability Correlation Chart
The statistical analysis conducted on geographies consisting of 579,581,803 people shows a significant positive correlation between the proportion of Irish and percentage of population with hearing disability in the United States with a correlation coefficient (R) of 0.629 and weighted average of 3.7%. Similarly, the statistical analysis conducted on geographies consisting of 316,957,288 people shows a moderate positive correlation between the proportion of Immigrants from Thailand and percentage of population with hearing disability in the United States with a correlation coefficient (R) of 0.423 and weighted average of 3.1%, a difference of 18.1%.
Hearing Disability Correlation Summary
| Measurement | Irish | Immigrants from Thailand |
| Minimum | 1.1% | 1.3% |
| Maximum | 42.5% | 14.1% |
| Range | 41.5% | 12.8% |
| Mean | 7.0% | 4.0% |
| Median | 4.0% | 3.2% |
| Interquartile 25% (IQ1) | 3.6% | 2.9% |
| Interquartile 75% (IQ3) | 8.1% | 3.6% |
| Interquartile Range (IQR) | 4.5% | 0.74% |
| Standard Deviation (Sample) | 6.6% | 2.3% |
| Standard Deviation (Population) | 6.6% | 2.3% |
Similar Demographics by Hearing Disability
Demographics Similar to Irish by Hearing Disability
In terms of hearing disability, the demographic groups most similar to Irish are Chinese (3.7%, a difference of 0.21%), White/Caucasian (3.7%, a difference of 0.34%), Finnish (3.7%, a difference of 0.35%), Native Hawaiian (3.7%, a difference of 0.42%), and Norwegian (3.7%, a difference of 0.48%).
| Demographics | Rating | Rank | Hearing Disability |
| Scandinavians | 0.0 /100 | #281 | Tragic 3.6% |
| Swedes | 0.0 /100 | #282 | Tragic 3.6% |
| Blackfeet | 0.0 /100 | #283 | Tragic 3.6% |
| Immigrants | Micronesia | 0.0 /100 | #284 | Tragic 3.6% |
| Sioux | 0.0 /100 | #285 | Tragic 3.6% |
| Delaware | 0.0 /100 | #286 | Tragic 3.6% |
| Spanish | 0.0 /100 | #287 | Tragic 3.7% |
| Irish | 0.0 /100 | #288 | Tragic 3.7% |
| Chinese | 0.0 /100 | #289 | Tragic 3.7% |
| Whites/Caucasians | 0.0 /100 | #290 | Tragic 3.7% |
| Finns | 0.0 /100 | #291 | Tragic 3.7% |
| Native Hawaiians | 0.0 /100 | #292 | Tragic 3.7% |
| Norwegians | 0.0 /100 | #293 | Tragic 3.7% |
| Iroquois | 0.0 /100 | #294 | Tragic 3.7% |
| Welsh | 0.0 /100 | #295 | Tragic 3.7% |
Demographics Similar to Immigrants from Thailand by Hearing Disability
In terms of hearing disability, the demographic groups most similar to Immigrants from Thailand are Immigrants from Denmark (3.1%, a difference of 0.040%), Immigrants from Czechoslovakia (3.1%, a difference of 0.090%), Alsatian (3.1%, a difference of 0.090%), Eastern European (3.1%, a difference of 0.16%), and Hispanic or Latino (3.1%, a difference of 0.22%).
| Demographics | Rating | Rank | Hearing Disability |
| Spanish American Indians | 24.1 /100 | #195 | Fair 3.1% |
| Immigrants | Europe | 22.9 /100 | #196 | Fair 3.1% |
| Immigrants | Bosnia and Herzegovina | 20.6 /100 | #197 | Fair 3.1% |
| Immigrants | Croatia | 20.5 /100 | #198 | Fair 3.1% |
| Syrians | 19.2 /100 | #199 | Poor 3.1% |
| Immigrants | North Macedonia | 19.1 /100 | #200 | Poor 3.1% |
| Iraqis | 19.0 /100 | #201 | Poor 3.1% |
| Immigrants | Thailand | 16.4 /100 | #202 | Poor 3.1% |
| Immigrants | Denmark | 16.2 /100 | #203 | Poor 3.1% |
| Immigrants | Czechoslovakia | 15.9 /100 | #204 | Poor 3.1% |
| Alsatians | 15.9 /100 | #205 | Poor 3.1% |
| Eastern Europeans | 15.5 /100 | #206 | Poor 3.1% |
| Hispanics or Latinos | 15.1 /100 | #207 | Poor 3.1% |
| Immigrants | Latvia | 12.7 /100 | #208 | Poor 3.1% |
| Immigrants | Hungary | 12.5 /100 | #209 | Poor 3.1% |