Bulgarian vs Immigrants from Thailand Hearing Disability
COMPARE
Bulgarian
Immigrants from Thailand
Hearing Disability
Hearing Disability Comparison
Bulgarians
Immigrants from Thailand
3.0%
HEARING DISABILITY
39.7/ 100
METRIC RATING
183rd/ 347
METRIC RANK
3.1%
HEARING DISABILITY
16.4/ 100
METRIC RATING
202nd/ 347
METRIC RANK
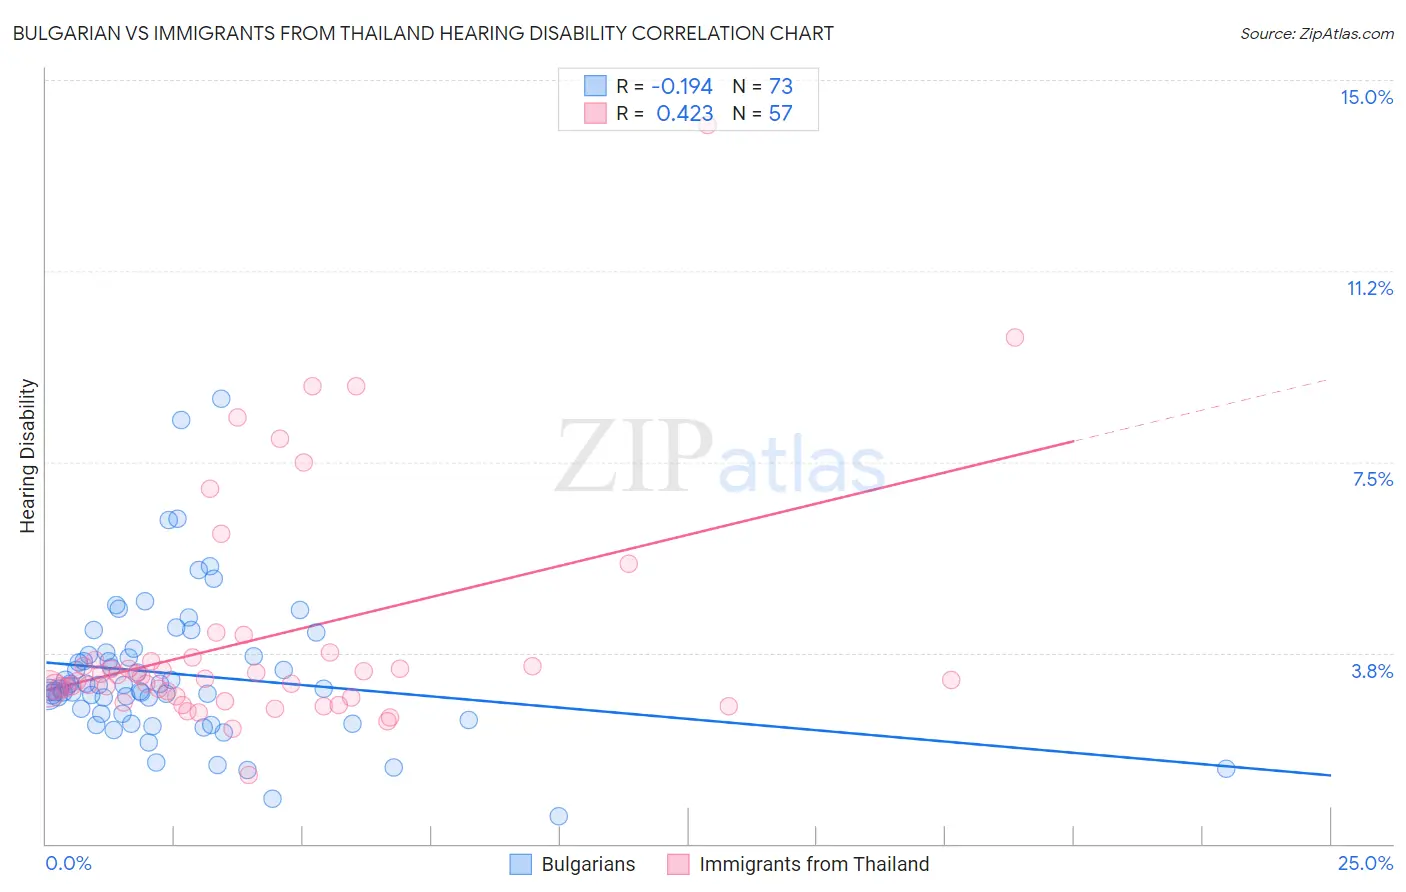
Bulgarian vs Immigrants from Thailand Hearing Disability Correlation Chart
The statistical analysis conducted on geographies consisting of 205,610,417 people shows a poor negative correlation between the proportion of Bulgarians and percentage of population with hearing disability in the United States with a correlation coefficient (R) of -0.194 and weighted average of 3.0%. Similarly, the statistical analysis conducted on geographies consisting of 316,957,288 people shows a moderate positive correlation between the proportion of Immigrants from Thailand and percentage of population with hearing disability in the United States with a correlation coefficient (R) of 0.423 and weighted average of 3.1%, a difference of 2.8%.
Hearing Disability Correlation Summary
| Measurement | Bulgarian | Immigrants from Thailand |
| Minimum | 0.54% | 1.3% |
| Maximum | 8.7% | 14.1% |
| Range | 8.2% | 12.8% |
| Mean | 3.3% | 4.0% |
| Median | 3.1% | 3.2% |
| Interquartile 25% (IQ1) | 2.5% | 2.9% |
| Interquartile 75% (IQ3) | 3.7% | 3.6% |
| Interquartile Range (IQR) | 1.2% | 0.74% |
| Standard Deviation (Sample) | 1.4% | 2.3% |
| Standard Deviation (Population) | 1.4% | 2.3% |
Demographics Similar to Bulgarians and Immigrants from Thailand by Hearing Disability
In terms of hearing disability, the demographic groups most similar to Bulgarians are Immigrants from Italy (3.0%, a difference of 0.14%), Immigrants from Ireland (3.0%, a difference of 0.23%), Immigrants from Southern Europe (3.0%, a difference of 0.44%), Immigrants from Mexico (3.0%, a difference of 0.49%), and Black/African American (3.0%, a difference of 0.50%). Similarly, the demographic groups most similar to Immigrants from Thailand are Iraqi (3.1%, a difference of 0.40%), Immigrants from North Macedonia (3.1%, a difference of 0.42%), Syrian (3.1%, a difference of 0.43%), Immigrants from Croatia (3.1%, a difference of 0.61%), and Immigrants from Bosnia and Herzegovina (3.1%, a difference of 0.63%).
| Demographics | Rating | Rank | Hearing Disability |
| Immigrants | Italy | 41.1 /100 | #182 | Average 3.0% |
| Bulgarians | 39.7 /100 | #183 | Fair 3.0% |
| Immigrants | Ireland | 37.4 /100 | #184 | Fair 3.0% |
| Immigrants | Southern Europe | 35.3 /100 | #185 | Fair 3.0% |
| Immigrants | Mexico | 34.9 /100 | #186 | Fair 3.0% |
| Blacks/African Americans | 34.7 /100 | #187 | Fair 3.0% |
| Mexican American Indians | 34.7 /100 | #188 | Fair 3.0% |
| Africans | 32.9 /100 | #189 | Fair 3.0% |
| Immigrants | South Africa | 31.1 /100 | #190 | Fair 3.1% |
| Immigrants | Switzerland | 28.8 /100 | #191 | Fair 3.1% |
| Koreans | 27.6 /100 | #192 | Fair 3.1% |
| Macedonians | 27.0 /100 | #193 | Fair 3.1% |
| South Africans | 24.5 /100 | #194 | Fair 3.1% |
| Spanish American Indians | 24.1 /100 | #195 | Fair 3.1% |
| Immigrants | Europe | 22.9 /100 | #196 | Fair 3.1% |
| Immigrants | Bosnia and Herzegovina | 20.6 /100 | #197 | Fair 3.1% |
| Immigrants | Croatia | 20.5 /100 | #198 | Fair 3.1% |
| Syrians | 19.2 /100 | #199 | Poor 3.1% |
| Immigrants | North Macedonia | 19.1 /100 | #200 | Poor 3.1% |
| Iraqis | 19.0 /100 | #201 | Poor 3.1% |
| Immigrants | Thailand | 16.4 /100 | #202 | Poor 3.1% |