Immigrants from Burma/Myanmar vs Immigrants from Thailand Hearing Disability
COMPARE
Immigrants from Burma/Myanmar
Immigrants from Thailand
Hearing Disability
Hearing Disability Comparison
Immigrants from Burma/Myanmar
Immigrants from Thailand
2.9%
HEARING DISABILITY
69.5/ 100
METRIC RATING
158th/ 347
METRIC RANK
3.1%
HEARING DISABILITY
16.4/ 100
METRIC RATING
202nd/ 347
METRIC RANK
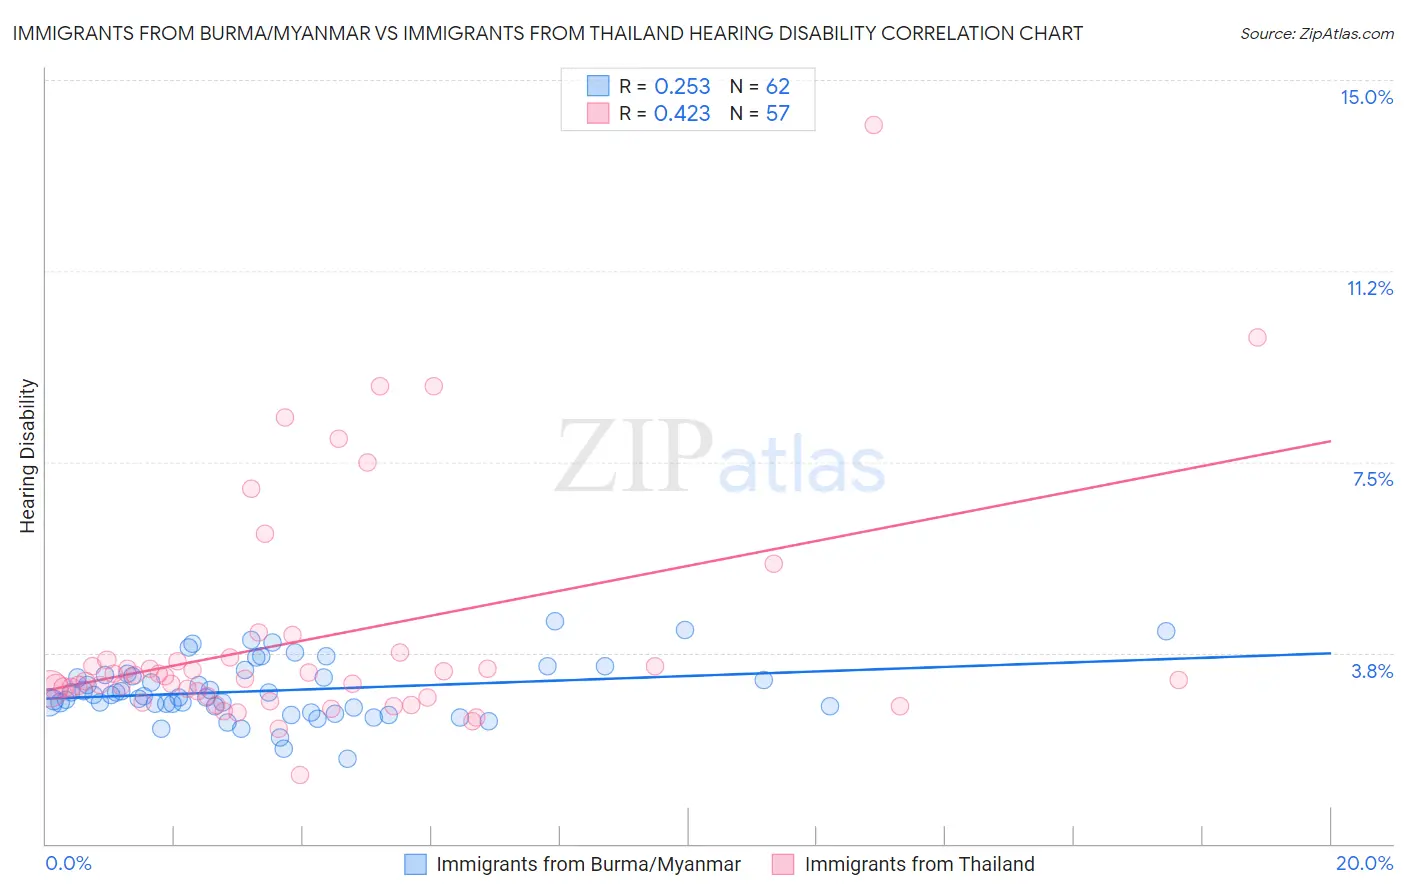
Immigrants from Burma/Myanmar vs Immigrants from Thailand Hearing Disability Correlation Chart
The statistical analysis conducted on geographies consisting of 172,316,169 people shows a weak positive correlation between the proportion of Immigrants from Burma/Myanmar and percentage of population with hearing disability in the United States with a correlation coefficient (R) of 0.253 and weighted average of 2.9%. Similarly, the statistical analysis conducted on geographies consisting of 316,957,288 people shows a moderate positive correlation between the proportion of Immigrants from Thailand and percentage of population with hearing disability in the United States with a correlation coefficient (R) of 0.423 and weighted average of 3.1%, a difference of 5.9%.
Hearing Disability Correlation Summary
| Measurement | Immigrants from Burma/Myanmar | Immigrants from Thailand |
| Minimum | 1.7% | 1.3% |
| Maximum | 4.4% | 14.1% |
| Range | 2.7% | 12.8% |
| Mean | 3.0% | 4.0% |
| Median | 2.9% | 3.2% |
| Interquartile 25% (IQ1) | 2.7% | 2.9% |
| Interquartile 75% (IQ3) | 3.3% | 3.6% |
| Interquartile Range (IQR) | 0.60% | 0.74% |
| Standard Deviation (Sample) | 0.56% | 2.3% |
| Standard Deviation (Population) | 0.56% | 2.3% |
Similar Demographics by Hearing Disability
Demographics Similar to Immigrants from Burma/Myanmar by Hearing Disability
In terms of hearing disability, the demographic groups most similar to Immigrants from Burma/Myanmar are Immigrants from Kazakhstan (2.9%, a difference of 0.010%), Immigrants from Poland (2.9%, a difference of 0.080%), Costa Rican (2.9%, a difference of 0.22%), Immigrants from Lebanon (2.9%, a difference of 0.23%), and Immigrants from Australia (2.9%, a difference of 0.23%).
| Demographics | Rating | Rank | Hearing Disability |
| Immigrants | France | 73.1 /100 | #151 | Good 2.9% |
| Immigrants | Lithuania | 73.0 /100 | #152 | Good 2.9% |
| Sudanese | 72.1 /100 | #153 | Good 2.9% |
| Immigrants | Lebanon | 71.5 /100 | #154 | Good 2.9% |
| Costa Ricans | 71.4 /100 | #155 | Good 2.9% |
| Immigrants | Poland | 70.2 /100 | #156 | Good 2.9% |
| Immigrants | Kazakhstan | 69.6 /100 | #157 | Good 2.9% |
| Immigrants | Burma/Myanmar | 69.5 /100 | #158 | Good 2.9% |
| Immigrants | Australia | 67.4 /100 | #159 | Good 2.9% |
| Immigrants | Fiji | 67.1 /100 | #160 | Good 2.9% |
| Albanians | 66.6 /100 | #161 | Good 2.9% |
| Immigrants | Japan | 66.3 /100 | #162 | Good 2.9% |
| Immigrants | Central America | 64.9 /100 | #163 | Good 3.0% |
| Immigrants | Cambodia | 64.8 /100 | #164 | Good 3.0% |
| Immigrants | Zimbabwe | 64.2 /100 | #165 | Good 3.0% |
Demographics Similar to Immigrants from Thailand by Hearing Disability
In terms of hearing disability, the demographic groups most similar to Immigrants from Thailand are Immigrants from Denmark (3.1%, a difference of 0.040%), Immigrants from Czechoslovakia (3.1%, a difference of 0.090%), Alsatian (3.1%, a difference of 0.090%), Eastern European (3.1%, a difference of 0.16%), and Hispanic or Latino (3.1%, a difference of 0.22%).
| Demographics | Rating | Rank | Hearing Disability |
| Spanish American Indians | 24.1 /100 | #195 | Fair 3.1% |
| Immigrants | Europe | 22.9 /100 | #196 | Fair 3.1% |
| Immigrants | Bosnia and Herzegovina | 20.6 /100 | #197 | Fair 3.1% |
| Immigrants | Croatia | 20.5 /100 | #198 | Fair 3.1% |
| Syrians | 19.2 /100 | #199 | Poor 3.1% |
| Immigrants | North Macedonia | 19.1 /100 | #200 | Poor 3.1% |
| Iraqis | 19.0 /100 | #201 | Poor 3.1% |
| Immigrants | Thailand | 16.4 /100 | #202 | Poor 3.1% |
| Immigrants | Denmark | 16.2 /100 | #203 | Poor 3.1% |
| Immigrants | Czechoslovakia | 15.9 /100 | #204 | Poor 3.1% |
| Alsatians | 15.9 /100 | #205 | Poor 3.1% |
| Eastern Europeans | 15.5 /100 | #206 | Poor 3.1% |
| Hispanics or Latinos | 15.1 /100 | #207 | Poor 3.1% |
| Immigrants | Latvia | 12.7 /100 | #208 | Poor 3.1% |
| Immigrants | Hungary | 12.5 /100 | #209 | Poor 3.1% |