Nepalese vs Paiute Male Disability
COMPARE
Nepalese
Paiute
Male Disability
Male Disability Comparison
Nepalese
Paiute
12.2%
MALE DISABILITY
0.2/ 100
METRIC RATING
264th/ 347
METRIC RANK
13.7%
MALE DISABILITY
0.0/ 100
METRIC RATING
317th/ 347
METRIC RANK
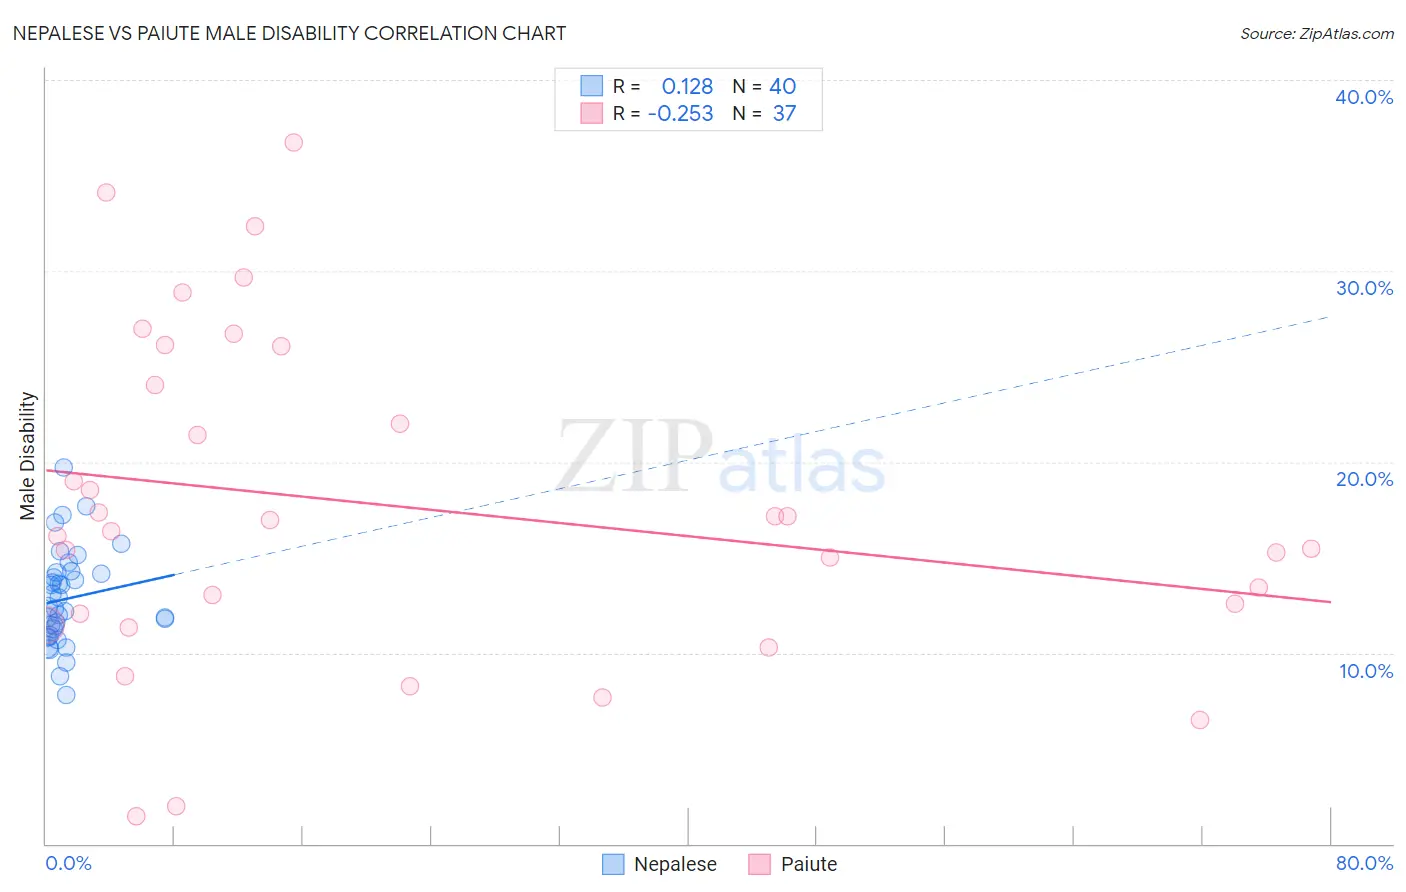
Nepalese vs Paiute Male Disability Correlation Chart
The statistical analysis conducted on geographies consisting of 24,521,755 people shows a poor positive correlation between the proportion of Nepalese and percentage of males with a disability in the United States with a correlation coefficient (R) of 0.128 and weighted average of 12.2%. Similarly, the statistical analysis conducted on geographies consisting of 58,394,227 people shows a weak negative correlation between the proportion of Paiute and percentage of males with a disability in the United States with a correlation coefficient (R) of -0.253 and weighted average of 13.7%, a difference of 12.1%.
Male Disability Correlation Summary
| Measurement | Nepalese | Paiute |
| Minimum | 7.8% | 1.5% |
| Maximum | 19.7% | 36.7% |
| Range | 11.9% | 35.3% |
| Mean | 12.8% | 17.7% |
| Median | 12.4% | 16.4% |
| Interquartile 25% (IQ1) | 11.1% | 11.8% |
| Interquartile 75% (IQ3) | 14.2% | 25.0% |
| Interquartile Range (IQR) | 3.1% | 13.3% |
| Standard Deviation (Sample) | 2.5% | 8.6% |
| Standard Deviation (Population) | 2.5% | 8.5% |
Similar Demographics by Male Disability
Demographics Similar to Nepalese by Male Disability
In terms of male disability, the demographic groups most similar to Nepalese are Canadian (12.2%, a difference of 0.030%), Norwegian (12.2%, a difference of 0.23%), Slavic (12.2%, a difference of 0.25%), Immigrants from Portugal (12.3%, a difference of 0.46%), and Hawaiian (12.3%, a difference of 0.47%).
| Demographics | Rating | Rank | Male Disability |
| Europeans | 0.3 /100 | #257 | Tragic 12.1% |
| Basques | 0.3 /100 | #258 | Tragic 12.1% |
| Belgians | 0.3 /100 | #259 | Tragic 12.1% |
| Swedes | 0.3 /100 | #260 | Tragic 12.1% |
| Slavs | 0.2 /100 | #261 | Tragic 12.2% |
| Norwegians | 0.2 /100 | #262 | Tragic 12.2% |
| Canadians | 0.2 /100 | #263 | Tragic 12.2% |
| Nepalese | 0.2 /100 | #264 | Tragic 12.2% |
| Immigrants | Portugal | 0.1 /100 | #265 | Tragic 12.3% |
| Hawaiians | 0.1 /100 | #266 | Tragic 12.3% |
| Immigrants | Germany | 0.1 /100 | #267 | Tragic 12.3% |
| Portuguese | 0.1 /100 | #268 | Tragic 12.3% |
| Czechoslovakians | 0.1 /100 | #269 | Tragic 12.3% |
| Spaniards | 0.1 /100 | #270 | Tragic 12.3% |
| Scandinavians | 0.1 /100 | #271 | Tragic 12.3% |
Demographics Similar to Paiute by Male Disability
In terms of male disability, the demographic groups most similar to Paiute are Cree (13.7%, a difference of 0.21%), American (13.8%, a difference of 0.62%), Alaska Native (13.6%, a difference of 0.80%), Iroquois (13.6%, a difference of 0.86%), and Aleut (13.5%, a difference of 1.0%).
| Demographics | Rating | Rank | Male Disability |
| Immigrants | Azores | 0.0 /100 | #310 | Tragic 13.4% |
| Delaware | 0.0 /100 | #311 | Tragic 13.5% |
| Yakama | 0.0 /100 | #312 | Tragic 13.5% |
| Puget Sound Salish | 0.0 /100 | #313 | Tragic 13.5% |
| Aleuts | 0.0 /100 | #314 | Tragic 13.5% |
| Iroquois | 0.0 /100 | #315 | Tragic 13.6% |
| Alaska Natives | 0.0 /100 | #316 | Tragic 13.6% |
| Paiute | 0.0 /100 | #317 | Tragic 13.7% |
| Cree | 0.0 /100 | #318 | Tragic 13.7% |
| Americans | 0.0 /100 | #319 | Tragic 13.8% |
| Tlingit-Haida | 0.0 /100 | #320 | Tragic 13.8% |
| Shoshone | 0.0 /100 | #321 | Tragic 13.8% |
| Apache | 0.0 /100 | #322 | Tragic 14.0% |
| Osage | 0.0 /100 | #323 | Tragic 14.0% |
| Comanche | 0.0 /100 | #324 | Tragic 14.1% |