Immigrants from Honduras vs Paiute Male Disability
COMPARE
Immigrants from Honduras
Paiute
Male Disability
Male Disability Comparison
Immigrants from Honduras
Paiute
11.2%
MALE DISABILITY
48.7/ 100
METRIC RATING
175th/ 347
METRIC RANK
13.7%
MALE DISABILITY
0.0/ 100
METRIC RATING
317th/ 347
METRIC RANK
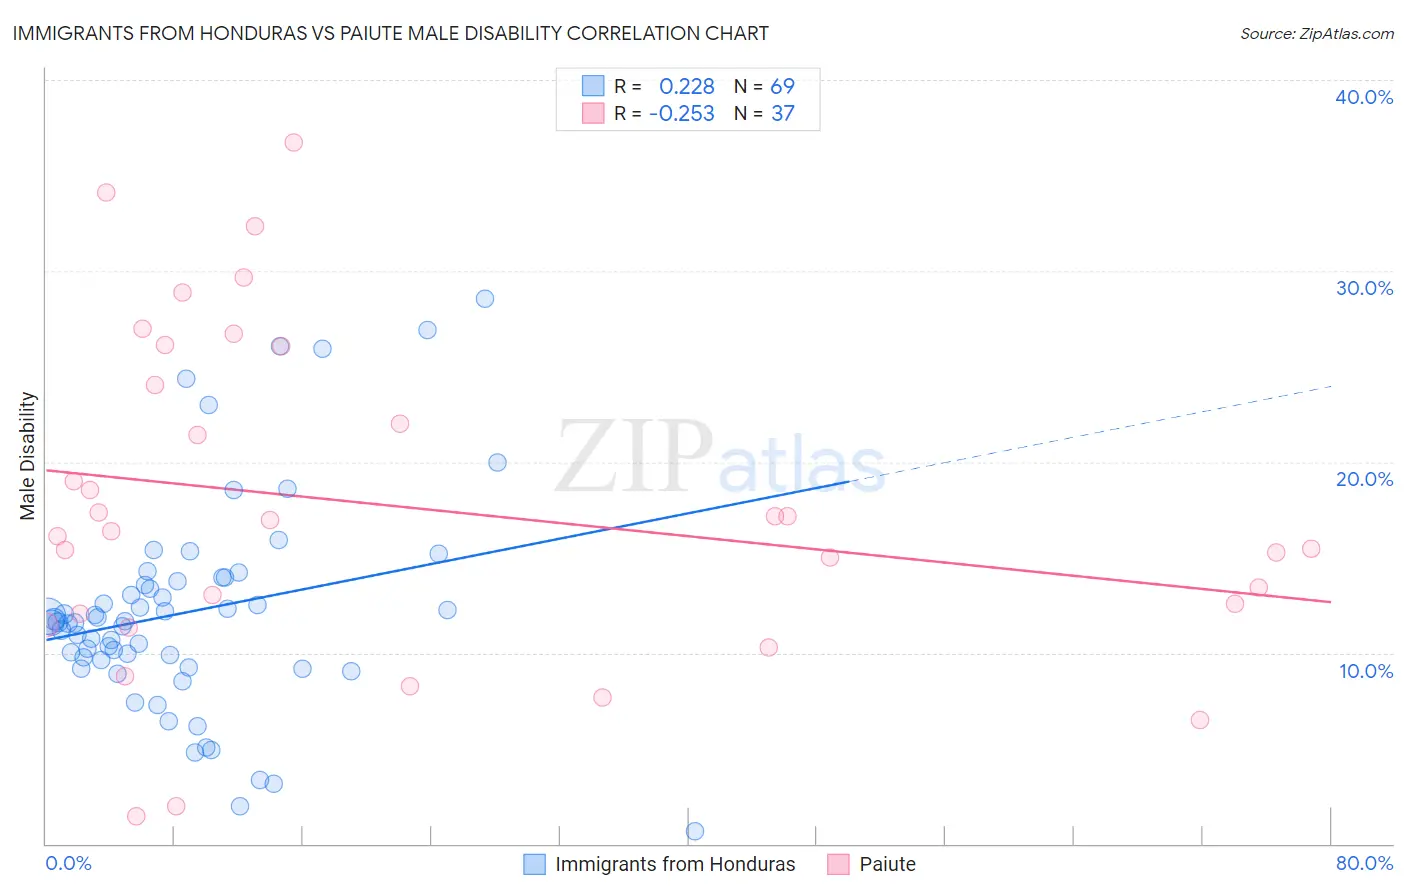
Immigrants from Honduras vs Paiute Male Disability Correlation Chart
The statistical analysis conducted on geographies consisting of 322,552,895 people shows a weak positive correlation between the proportion of Immigrants from Honduras and percentage of males with a disability in the United States with a correlation coefficient (R) of 0.228 and weighted average of 11.2%. Similarly, the statistical analysis conducted on geographies consisting of 58,394,227 people shows a weak negative correlation between the proportion of Paiute and percentage of males with a disability in the United States with a correlation coefficient (R) of -0.253 and weighted average of 13.7%, a difference of 21.9%.
Male Disability Correlation Summary
| Measurement | Immigrants from Honduras | Paiute |
| Minimum | 0.65% | 1.5% |
| Maximum | 28.6% | 36.7% |
| Range | 27.9% | 35.3% |
| Mean | 12.2% | 17.7% |
| Median | 11.6% | 16.4% |
| Interquartile 25% (IQ1) | 9.4% | 11.8% |
| Interquartile 75% (IQ3) | 13.8% | 25.0% |
| Interquartile Range (IQR) | 4.4% | 13.3% |
| Standard Deviation (Sample) | 5.6% | 8.6% |
| Standard Deviation (Population) | 5.5% | 8.5% |
Similar Demographics by Male Disability
Demographics Similar to Immigrants from Honduras by Male Disability
In terms of male disability, the demographic groups most similar to Immigrants from Honduras are Maltese (11.2%, a difference of 0.070%), Immigrants from Burma/Myanmar (11.2%, a difference of 0.10%), Romanian (11.2%, a difference of 0.12%), Syrian (11.2%, a difference of 0.12%), and Haitian (11.2%, a difference of 0.21%).
| Demographics | Rating | Rank | Male Disability |
| Immigrants | Latin America | 54.0 /100 | #168 | Average 11.2% |
| Barbadians | 53.4 /100 | #169 | Average 11.2% |
| New Zealanders | 52.9 /100 | #170 | Average 11.2% |
| Haitians | 52.5 /100 | #171 | Average 11.2% |
| Romanians | 50.7 /100 | #172 | Average 11.2% |
| Immigrants | Burma/Myanmar | 50.4 /100 | #173 | Average 11.2% |
| Maltese | 50.0 /100 | #174 | Average 11.2% |
| Immigrants | Honduras | 48.7 /100 | #175 | Average 11.2% |
| Syrians | 46.6 /100 | #176 | Average 11.2% |
| Immigrants | Norway | 44.2 /100 | #177 | Average 11.3% |
| Australians | 42.2 /100 | #178 | Average 11.3% |
| Immigrants | Caribbean | 41.4 /100 | #179 | Average 11.3% |
| Hondurans | 41.1 /100 | #180 | Average 11.3% |
| Immigrants | Senegal | 34.4 /100 | #181 | Fair 11.3% |
| Immigrants | Belize | 33.7 /100 | #182 | Fair 11.3% |
Demographics Similar to Paiute by Male Disability
In terms of male disability, the demographic groups most similar to Paiute are Cree (13.7%, a difference of 0.21%), American (13.8%, a difference of 0.62%), Alaska Native (13.6%, a difference of 0.80%), Iroquois (13.6%, a difference of 0.86%), and Aleut (13.5%, a difference of 1.0%).
| Demographics | Rating | Rank | Male Disability |
| Immigrants | Azores | 0.0 /100 | #310 | Tragic 13.4% |
| Delaware | 0.0 /100 | #311 | Tragic 13.5% |
| Yakama | 0.0 /100 | #312 | Tragic 13.5% |
| Puget Sound Salish | 0.0 /100 | #313 | Tragic 13.5% |
| Aleuts | 0.0 /100 | #314 | Tragic 13.5% |
| Iroquois | 0.0 /100 | #315 | Tragic 13.6% |
| Alaska Natives | 0.0 /100 | #316 | Tragic 13.6% |
| Paiute | 0.0 /100 | #317 | Tragic 13.7% |
| Cree | 0.0 /100 | #318 | Tragic 13.7% |
| Americans | 0.0 /100 | #319 | Tragic 13.8% |
| Tlingit-Haida | 0.0 /100 | #320 | Tragic 13.8% |
| Shoshone | 0.0 /100 | #321 | Tragic 13.8% |
| Apache | 0.0 /100 | #322 | Tragic 14.0% |
| Osage | 0.0 /100 | #323 | Tragic 14.0% |
| Comanche | 0.0 /100 | #324 | Tragic 14.1% |