Nepalese vs Immigrants from Bulgaria Male Disability
COMPARE
Nepalese
Immigrants from Bulgaria
Male Disability
Male Disability Comparison
Nepalese
Immigrants from Bulgaria
12.2%
MALE DISABILITY
0.2/ 100
METRIC RATING
264th/ 347
METRIC RANK
10.5%
MALE DISABILITY
99.1/ 100
METRIC RATING
70th/ 347
METRIC RANK
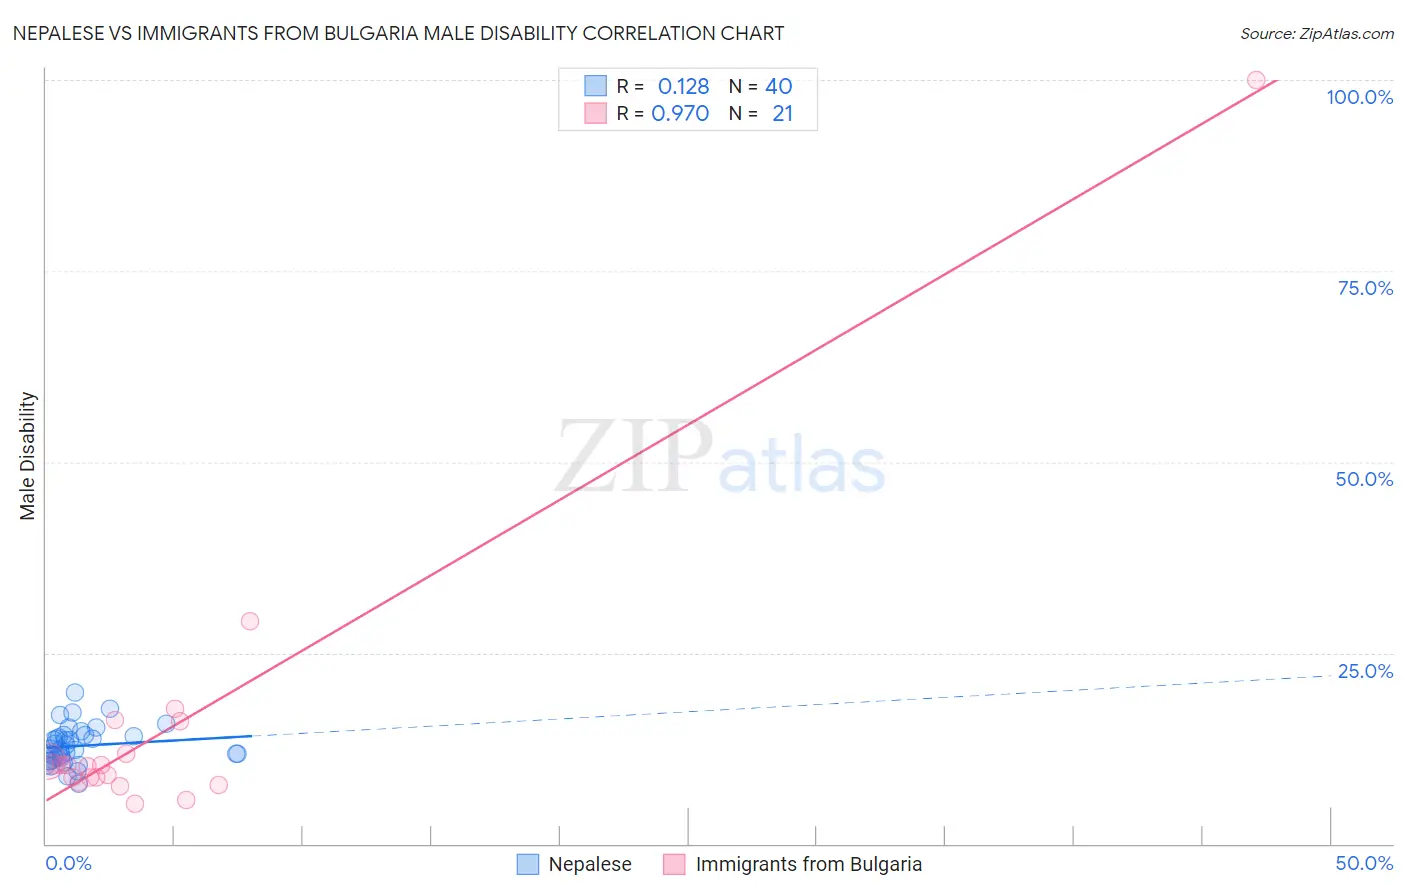
Nepalese vs Immigrants from Bulgaria Male Disability Correlation Chart
The statistical analysis conducted on geographies consisting of 24,521,755 people shows a poor positive correlation between the proportion of Nepalese and percentage of males with a disability in the United States with a correlation coefficient (R) of 0.128 and weighted average of 12.2%. Similarly, the statistical analysis conducted on geographies consisting of 172,550,350 people shows a perfect positive correlation between the proportion of Immigrants from Bulgaria and percentage of males with a disability in the United States with a correlation coefficient (R) of 0.970 and weighted average of 10.5%, a difference of 16.4%.
Male Disability Correlation Summary
| Measurement | Nepalese | Immigrants from Bulgaria |
| Minimum | 7.8% | 5.2% |
| Maximum | 19.7% | 100.0% |
| Range | 11.9% | 94.8% |
| Mean | 12.8% | 15.4% |
| Median | 12.4% | 10.3% |
| Interquartile 25% (IQ1) | 11.1% | 8.3% |
| Interquartile 75% (IQ3) | 14.2% | 14.0% |
| Interquartile Range (IQR) | 3.1% | 5.7% |
| Standard Deviation (Sample) | 2.5% | 20.1% |
| Standard Deviation (Population) | 2.5% | 19.6% |
Similar Demographics by Male Disability
Demographics Similar to Nepalese by Male Disability
In terms of male disability, the demographic groups most similar to Nepalese are Canadian (12.2%, a difference of 0.030%), Norwegian (12.2%, a difference of 0.23%), Slavic (12.2%, a difference of 0.25%), Immigrants from Portugal (12.3%, a difference of 0.46%), and Hawaiian (12.3%, a difference of 0.47%).
| Demographics | Rating | Rank | Male Disability |
| Europeans | 0.3 /100 | #257 | Tragic 12.1% |
| Basques | 0.3 /100 | #258 | Tragic 12.1% |
| Belgians | 0.3 /100 | #259 | Tragic 12.1% |
| Swedes | 0.3 /100 | #260 | Tragic 12.1% |
| Slavs | 0.2 /100 | #261 | Tragic 12.2% |
| Norwegians | 0.2 /100 | #262 | Tragic 12.2% |
| Canadians | 0.2 /100 | #263 | Tragic 12.2% |
| Nepalese | 0.2 /100 | #264 | Tragic 12.2% |
| Immigrants | Portugal | 0.1 /100 | #265 | Tragic 12.3% |
| Hawaiians | 0.1 /100 | #266 | Tragic 12.3% |
| Immigrants | Germany | 0.1 /100 | #267 | Tragic 12.3% |
| Portuguese | 0.1 /100 | #268 | Tragic 12.3% |
| Czechoslovakians | 0.1 /100 | #269 | Tragic 12.3% |
| Spaniards | 0.1 /100 | #270 | Tragic 12.3% |
| Scandinavians | 0.1 /100 | #271 | Tragic 12.3% |
Demographics Similar to Immigrants from Bulgaria by Male Disability
In terms of male disability, the demographic groups most similar to Immigrants from Bulgaria are Colombian (10.5%, a difference of 0.14%), Ecuadorian (10.5%, a difference of 0.14%), Immigrants from Cameroon (10.5%, a difference of 0.15%), Immigrants from Serbia (10.5%, a difference of 0.20%), and Immigrants from Afghanistan (10.5%, a difference of 0.24%).
| Demographics | Rating | Rank | Male Disability |
| Immigrants | Belarus | 99.3 /100 | #63 | Exceptional 10.4% |
| Jordanians | 99.3 /100 | #64 | Exceptional 10.5% |
| Immigrants | Grenada | 99.2 /100 | #65 | Exceptional 10.5% |
| Guyanese | 99.2 /100 | #66 | Exceptional 10.5% |
| Immigrants | Afghanistan | 99.2 /100 | #67 | Exceptional 10.5% |
| Colombians | 99.2 /100 | #68 | Exceptional 10.5% |
| Ecuadorians | 99.2 /100 | #69 | Exceptional 10.5% |
| Immigrants | Bulgaria | 99.1 /100 | #70 | Exceptional 10.5% |
| Immigrants | Cameroon | 99.0 /100 | #71 | Exceptional 10.5% |
| Immigrants | Serbia | 99.0 /100 | #72 | Exceptional 10.5% |
| Immigrants | Lithuania | 98.9 /100 | #73 | Exceptional 10.5% |
| Immigrants | Lebanon | 98.8 /100 | #74 | Exceptional 10.5% |
| Sierra Leoneans | 98.7 /100 | #75 | Exceptional 10.5% |
| Immigrants | Sierra Leone | 98.7 /100 | #76 | Exceptional 10.5% |
| Laotians | 98.6 /100 | #77 | Exceptional 10.6% |