Nepalese vs Immigrants from Cuba Male Disability
COMPARE
Nepalese
Immigrants from Cuba
Male Disability
Male Disability Comparison
Nepalese
Immigrants from Cuba
12.2%
MALE DISABILITY
0.2/ 100
METRIC RATING
264th/ 347
METRIC RANK
10.9%
MALE DISABILITY
90.2/ 100
METRIC RATING
118th/ 347
METRIC RANK
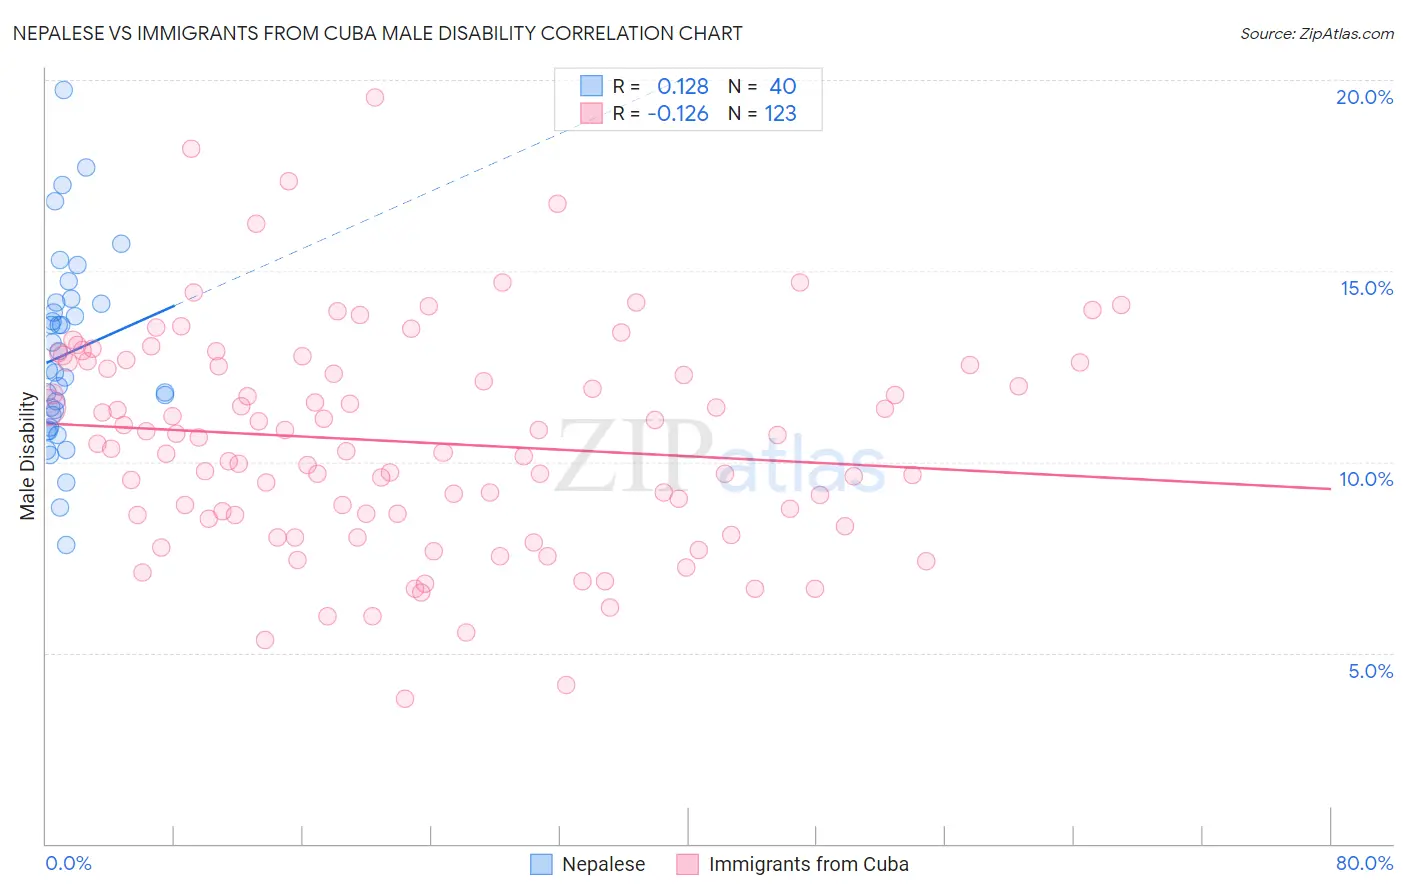
Nepalese vs Immigrants from Cuba Male Disability Correlation Chart
The statistical analysis conducted on geographies consisting of 24,521,755 people shows a poor positive correlation between the proportion of Nepalese and percentage of males with a disability in the United States with a correlation coefficient (R) of 0.128 and weighted average of 12.2%. Similarly, the statistical analysis conducted on geographies consisting of 325,990,586 people shows a poor negative correlation between the proportion of Immigrants from Cuba and percentage of males with a disability in the United States with a correlation coefficient (R) of -0.126 and weighted average of 10.9%, a difference of 12.2%.
Male Disability Correlation Summary
| Measurement | Nepalese | Immigrants from Cuba |
| Minimum | 7.8% | 3.8% |
| Maximum | 19.7% | 19.5% |
| Range | 11.9% | 15.7% |
| Mean | 12.8% | 10.5% |
| Median | 12.4% | 10.5% |
| Interquartile 25% (IQ1) | 11.1% | 8.6% |
| Interquartile 75% (IQ3) | 14.2% | 12.6% |
| Interquartile Range (IQR) | 3.1% | 4.0% |
| Standard Deviation (Sample) | 2.5% | 2.9% |
| Standard Deviation (Population) | 2.5% | 2.8% |
Similar Demographics by Male Disability
Demographics Similar to Nepalese by Male Disability
In terms of male disability, the demographic groups most similar to Nepalese are Canadian (12.2%, a difference of 0.030%), Norwegian (12.2%, a difference of 0.23%), Slavic (12.2%, a difference of 0.25%), Immigrants from Portugal (12.3%, a difference of 0.46%), and Hawaiian (12.3%, a difference of 0.47%).
| Demographics | Rating | Rank | Male Disability |
| Europeans | 0.3 /100 | #257 | Tragic 12.1% |
| Basques | 0.3 /100 | #258 | Tragic 12.1% |
| Belgians | 0.3 /100 | #259 | Tragic 12.1% |
| Swedes | 0.3 /100 | #260 | Tragic 12.1% |
| Slavs | 0.2 /100 | #261 | Tragic 12.2% |
| Norwegians | 0.2 /100 | #262 | Tragic 12.2% |
| Canadians | 0.2 /100 | #263 | Tragic 12.2% |
| Nepalese | 0.2 /100 | #264 | Tragic 12.2% |
| Immigrants | Portugal | 0.1 /100 | #265 | Tragic 12.3% |
| Hawaiians | 0.1 /100 | #266 | Tragic 12.3% |
| Immigrants | Germany | 0.1 /100 | #267 | Tragic 12.3% |
| Portuguese | 0.1 /100 | #268 | Tragic 12.3% |
| Czechoslovakians | 0.1 /100 | #269 | Tragic 12.3% |
| Spaniards | 0.1 /100 | #270 | Tragic 12.3% |
| Scandinavians | 0.1 /100 | #271 | Tragic 12.3% |
Demographics Similar to Immigrants from Cuba by Male Disability
In terms of male disability, the demographic groups most similar to Immigrants from Cuba are Armenian (10.9%, a difference of 0.0%), Eastern European (10.9%, a difference of 0.080%), Immigrants from Africa (10.9%, a difference of 0.11%), Immigrants from South Eastern Asia (10.9%, a difference of 0.15%), and Immigrants from Ghana (10.9%, a difference of 0.17%).
| Demographics | Rating | Rank | Male Disability |
| Immigrants | Uruguay | 93.8 /100 | #111 | Exceptional 10.8% |
| Ghanaians | 93.4 /100 | #112 | Exceptional 10.8% |
| Immigrants | Zimbabwe | 93.0 /100 | #113 | Exceptional 10.8% |
| Central Americans | 92.7 /100 | #114 | Exceptional 10.8% |
| Immigrants | Barbados | 92.2 /100 | #115 | Exceptional 10.8% |
| Immigrants | South Africa | 91.8 /100 | #116 | Exceptional 10.8% |
| Eastern Europeans | 90.6 /100 | #117 | Exceptional 10.9% |
| Immigrants | Cuba | 90.2 /100 | #118 | Exceptional 10.9% |
| Armenians | 90.1 /100 | #119 | Exceptional 10.9% |
| Immigrants | Africa | 89.4 /100 | #120 | Excellent 10.9% |
| Immigrants | South Eastern Asia | 89.2 /100 | #121 | Excellent 10.9% |
| Immigrants | Ghana | 89.0 /100 | #122 | Excellent 10.9% |
| Immigrants | Czechoslovakia | 88.4 /100 | #123 | Excellent 10.9% |
| South American Indians | 88.1 /100 | #124 | Excellent 10.9% |
| Immigrants | North Macedonia | 88.1 /100 | #125 | Excellent 10.9% |