Immigrants from Dominican Republic vs Paiute Male Disability
COMPARE
Immigrants from Dominican Republic
Paiute
Male Disability
Male Disability Comparison
Immigrants from Dominican Republic
Paiute
11.7%
MALE DISABILITY
4.9/ 100
METRIC RATING
216th/ 347
METRIC RANK
13.7%
MALE DISABILITY
0.0/ 100
METRIC RATING
317th/ 347
METRIC RANK
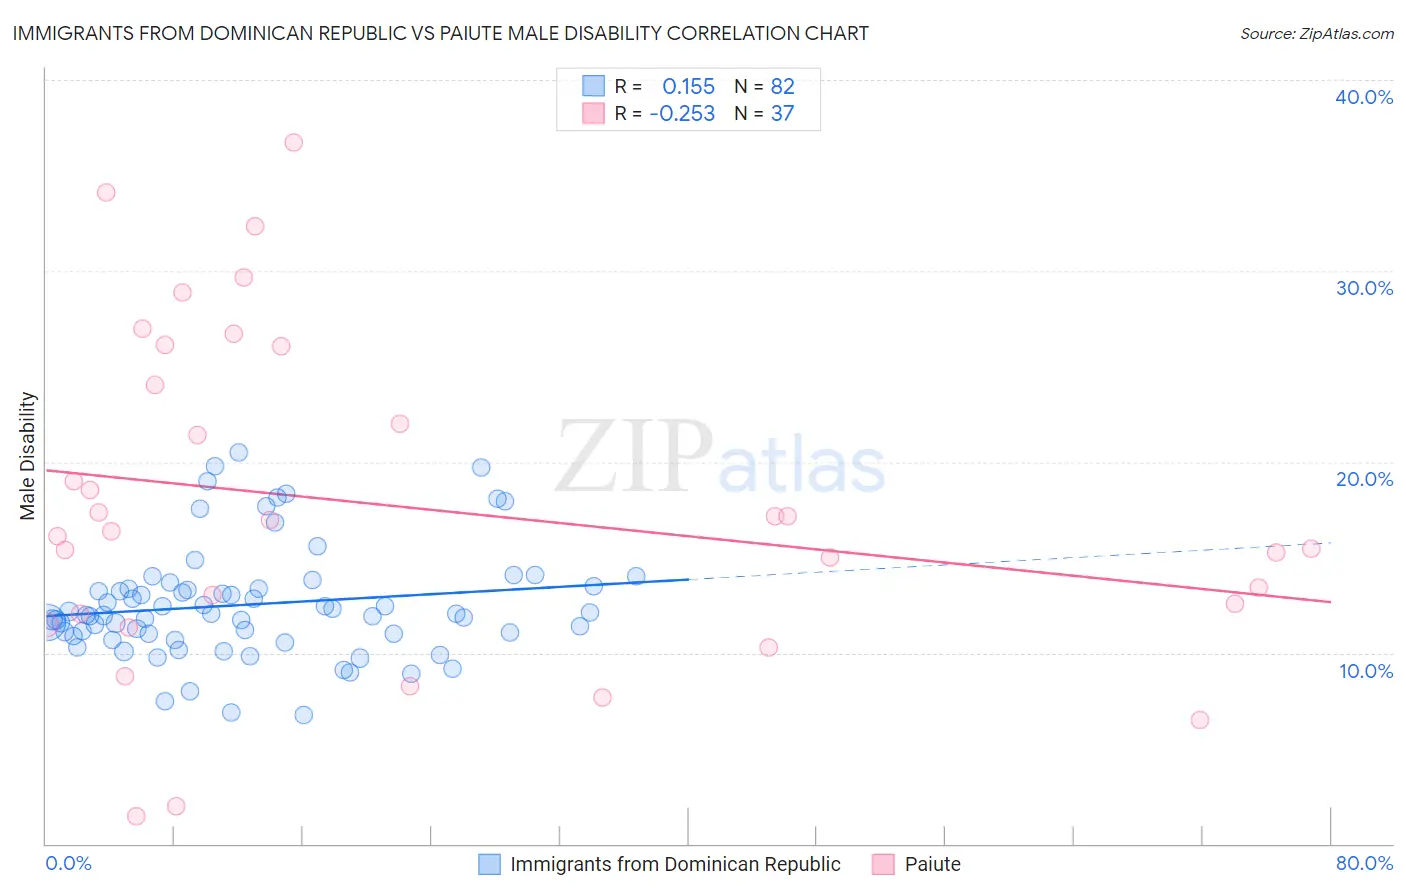
Immigrants from Dominican Republic vs Paiute Male Disability Correlation Chart
The statistical analysis conducted on geographies consisting of 275,063,348 people shows a poor positive correlation between the proportion of Immigrants from Dominican Republic and percentage of males with a disability in the United States with a correlation coefficient (R) of 0.155 and weighted average of 11.7%. Similarly, the statistical analysis conducted on geographies consisting of 58,394,227 people shows a weak negative correlation between the proportion of Paiute and percentage of males with a disability in the United States with a correlation coefficient (R) of -0.253 and weighted average of 13.7%, a difference of 17.2%.
Male Disability Correlation Summary
| Measurement | Immigrants from Dominican Republic | Paiute |
| Minimum | 6.8% | 1.5% |
| Maximum | 20.5% | 36.7% |
| Range | 13.7% | 35.3% |
| Mean | 12.5% | 17.7% |
| Median | 12.0% | 16.4% |
| Interquartile 25% (IQ1) | 11.0% | 11.8% |
| Interquartile 75% (IQ3) | 13.4% | 25.0% |
| Interquartile Range (IQR) | 2.4% | 13.3% |
| Standard Deviation (Sample) | 2.9% | 8.6% |
| Standard Deviation (Population) | 2.9% | 8.5% |
Similar Demographics by Male Disability
Demographics Similar to Immigrants from Dominican Republic by Male Disability
In terms of male disability, the demographic groups most similar to Immigrants from Dominican Republic are Immigrants from Dominica (11.7%, a difference of 0.070%), Indonesian (11.6%, a difference of 0.28%), Immigrants from England (11.7%, a difference of 0.28%), Panamanian (11.7%, a difference of 0.34%), and Immigrants from Western Europe (11.7%, a difference of 0.35%).
| Demographics | Rating | Rank | Male Disability |
| Spanish American Indians | 10.1 /100 | #209 | Poor 11.6% |
| Ute | 9.4 /100 | #210 | Tragic 11.6% |
| Immigrants | Thailand | 8.4 /100 | #211 | Tragic 11.6% |
| Immigrants | Scotland | 8.2 /100 | #212 | Tragic 11.6% |
| Mexican American Indians | 7.8 /100 | #213 | Tragic 11.6% |
| Lithuanians | 6.6 /100 | #214 | Tragic 11.6% |
| Indonesians | 5.9 /100 | #215 | Tragic 11.6% |
| Immigrants | Dominican Republic | 4.9 /100 | #216 | Tragic 11.7% |
| Immigrants | Dominica | 4.6 /100 | #217 | Tragic 11.7% |
| Immigrants | England | 4.0 /100 | #218 | Tragic 11.7% |
| Panamanians | 3.8 /100 | #219 | Tragic 11.7% |
| Immigrants | Western Europe | 3.8 /100 | #220 | Tragic 11.7% |
| Immigrants | Congo | 3.7 /100 | #221 | Tragic 11.7% |
| Alsatians | 3.3 /100 | #222 | Tragic 11.7% |
| Immigrants | Bahamas | 3.2 /100 | #223 | Tragic 11.7% |
Demographics Similar to Paiute by Male Disability
In terms of male disability, the demographic groups most similar to Paiute are Cree (13.7%, a difference of 0.21%), American (13.8%, a difference of 0.62%), Alaska Native (13.6%, a difference of 0.80%), Iroquois (13.6%, a difference of 0.86%), and Aleut (13.5%, a difference of 1.0%).
| Demographics | Rating | Rank | Male Disability |
| Immigrants | Azores | 0.0 /100 | #310 | Tragic 13.4% |
| Delaware | 0.0 /100 | #311 | Tragic 13.5% |
| Yakama | 0.0 /100 | #312 | Tragic 13.5% |
| Puget Sound Salish | 0.0 /100 | #313 | Tragic 13.5% |
| Aleuts | 0.0 /100 | #314 | Tragic 13.5% |
| Iroquois | 0.0 /100 | #315 | Tragic 13.6% |
| Alaska Natives | 0.0 /100 | #316 | Tragic 13.6% |
| Paiute | 0.0 /100 | #317 | Tragic 13.7% |
| Cree | 0.0 /100 | #318 | Tragic 13.7% |
| Americans | 0.0 /100 | #319 | Tragic 13.8% |
| Tlingit-Haida | 0.0 /100 | #320 | Tragic 13.8% |
| Shoshone | 0.0 /100 | #321 | Tragic 13.8% |
| Apache | 0.0 /100 | #322 | Tragic 14.0% |
| Osage | 0.0 /100 | #323 | Tragic 14.0% |
| Comanche | 0.0 /100 | #324 | Tragic 14.1% |