Nepalese vs Paiute In Labor Force | Age 45-54
COMPARE
Nepalese
Paiute
In Labor Force | Age 45-54
In Labor Force | Age 45-54 Comparison
Nepalese
Paiute
80.5%
IN LABOR FORCE | AGE 45-54
0.0/ 100
METRIC RATING
295th/ 347
METRIC RANK
76.7%
IN LABOR FORCE | AGE 45-54
0.0/ 100
METRIC RATING
336th/ 347
METRIC RANK
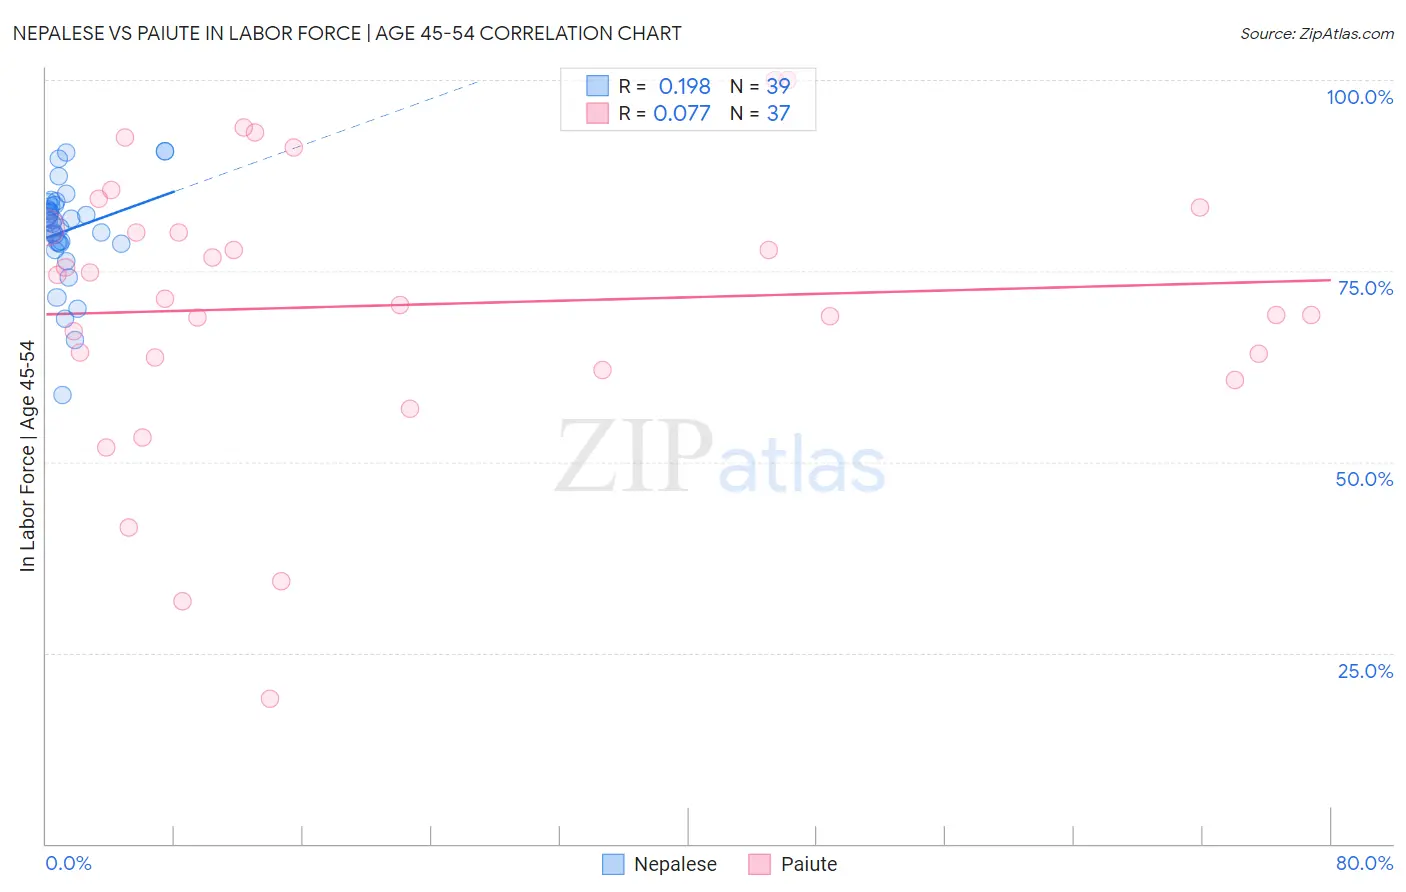
Nepalese vs Paiute In Labor Force | Age 45-54 Correlation Chart
The statistical analysis conducted on geographies consisting of 24,500,920 people shows a poor positive correlation between the proportion of Nepalese and labor force participation rate among population between the ages 45 and 54 in the United States with a correlation coefficient (R) of 0.198 and weighted average of 80.5%. Similarly, the statistical analysis conducted on geographies consisting of 58,396,210 people shows a slight positive correlation between the proportion of Paiute and labor force participation rate among population between the ages 45 and 54 in the United States with a correlation coefficient (R) of 0.077 and weighted average of 76.7%, a difference of 5.1%.
In Labor Force | Age 45-54 Correlation Summary
| Measurement | Nepalese | Paiute |
| Minimum | 58.7% | 19.0% |
| Maximum | 90.6% | 100.0% |
| Range | 31.9% | 81.0% |
| Mean | 80.3% | 70.5% |
| Median | 81.4% | 71.4% |
| Interquartile 25% (IQ1) | 78.6% | 62.9% |
| Interquartile 75% (IQ3) | 83.7% | 82.0% |
| Interquartile Range (IQR) | 5.1% | 19.1% |
| Standard Deviation (Sample) | 6.6% | 18.4% |
| Standard Deviation (Population) | 6.5% | 18.2% |
Similar Demographics by In Labor Force | Age 45-54
Demographics Similar to Nepalese by In Labor Force | Age 45-54
In terms of in labor force | age 45-54, the demographic groups most similar to Nepalese are African (80.5%, a difference of 0.040%), Osage (80.6%, a difference of 0.070%), Yakama (80.6%, a difference of 0.070%), Iroquois (80.6%, a difference of 0.090%), and Immigrants from Belize (80.6%, a difference of 0.12%).
| Demographics | Rating | Rank | In Labor Force | Age 45-54 |
| Cree | 0.0 /100 | #288 | Tragic 80.8% |
| Immigrants | Bangladesh | 0.0 /100 | #289 | Tragic 80.7% |
| Mexican American Indians | 0.0 /100 | #290 | Tragic 80.7% |
| Immigrants | Belize | 0.0 /100 | #291 | Tragic 80.6% |
| Iroquois | 0.0 /100 | #292 | Tragic 80.6% |
| Osage | 0.0 /100 | #293 | Tragic 80.6% |
| Yakama | 0.0 /100 | #294 | Tragic 80.6% |
| Nepalese | 0.0 /100 | #295 | Tragic 80.5% |
| Africans | 0.0 /100 | #296 | Tragic 80.5% |
| Americans | 0.0 /100 | #297 | Tragic 80.4% |
| Marshallese | 0.0 /100 | #298 | Tragic 80.3% |
| Dominicans | 0.0 /100 | #299 | Tragic 80.3% |
| Fijians | 0.0 /100 | #300 | Tragic 80.2% |
| Spanish American Indians | 0.0 /100 | #301 | Tragic 80.2% |
| Immigrants | Central America | 0.0 /100 | #302 | Tragic 80.2% |
Demographics Similar to Paiute by In Labor Force | Age 45-54
In terms of in labor force | age 45-54, the demographic groups most similar to Paiute are Ute (76.6%, a difference of 0.060%), Yuman (76.3%, a difference of 0.47%), Arapaho (77.1%, a difference of 0.54%), Native/Alaskan (77.1%, a difference of 0.61%), and Apache (77.1%, a difference of 0.61%).
| Demographics | Rating | Rank | In Labor Force | Age 45-54 |
| Creek | 0.0 /100 | #329 | Tragic 77.7% |
| Cheyenne | 0.0 /100 | #330 | Tragic 77.6% |
| Tsimshian | 0.0 /100 | #331 | Tragic 77.4% |
| Menominee | 0.0 /100 | #332 | Tragic 77.4% |
| Natives/Alaskans | 0.0 /100 | #333 | Tragic 77.1% |
| Apache | 0.0 /100 | #334 | Tragic 77.1% |
| Arapaho | 0.0 /100 | #335 | Tragic 77.1% |
| Paiute | 0.0 /100 | #336 | Tragic 76.7% |
| Ute | 0.0 /100 | #337 | Tragic 76.6% |
| Yuman | 0.0 /100 | #338 | Tragic 76.3% |
| Puerto Ricans | 0.0 /100 | #339 | Tragic 75.9% |
| Lumbee | 0.0 /100 | #340 | Tragic 75.6% |
| Pueblo | 0.0 /100 | #341 | Tragic 75.5% |
| Tohono O'odham | 0.0 /100 | #342 | Tragic 75.1% |
| Hopi | 0.0 /100 | #343 | Tragic 75.0% |