Cypriot vs Immigrants from Cambodia Female Disability
COMPARE
Cypriot
Immigrants from Cambodia
Female Disability
Female Disability Comparison
Cypriots
Immigrants from Cambodia
11.2%
FEMALE DISABILITY
100.0/ 100
METRIC RATING
36th/ 347
METRIC RANK
12.5%
FEMALE DISABILITY
7.8/ 100
METRIC RATING
228th/ 347
METRIC RANK
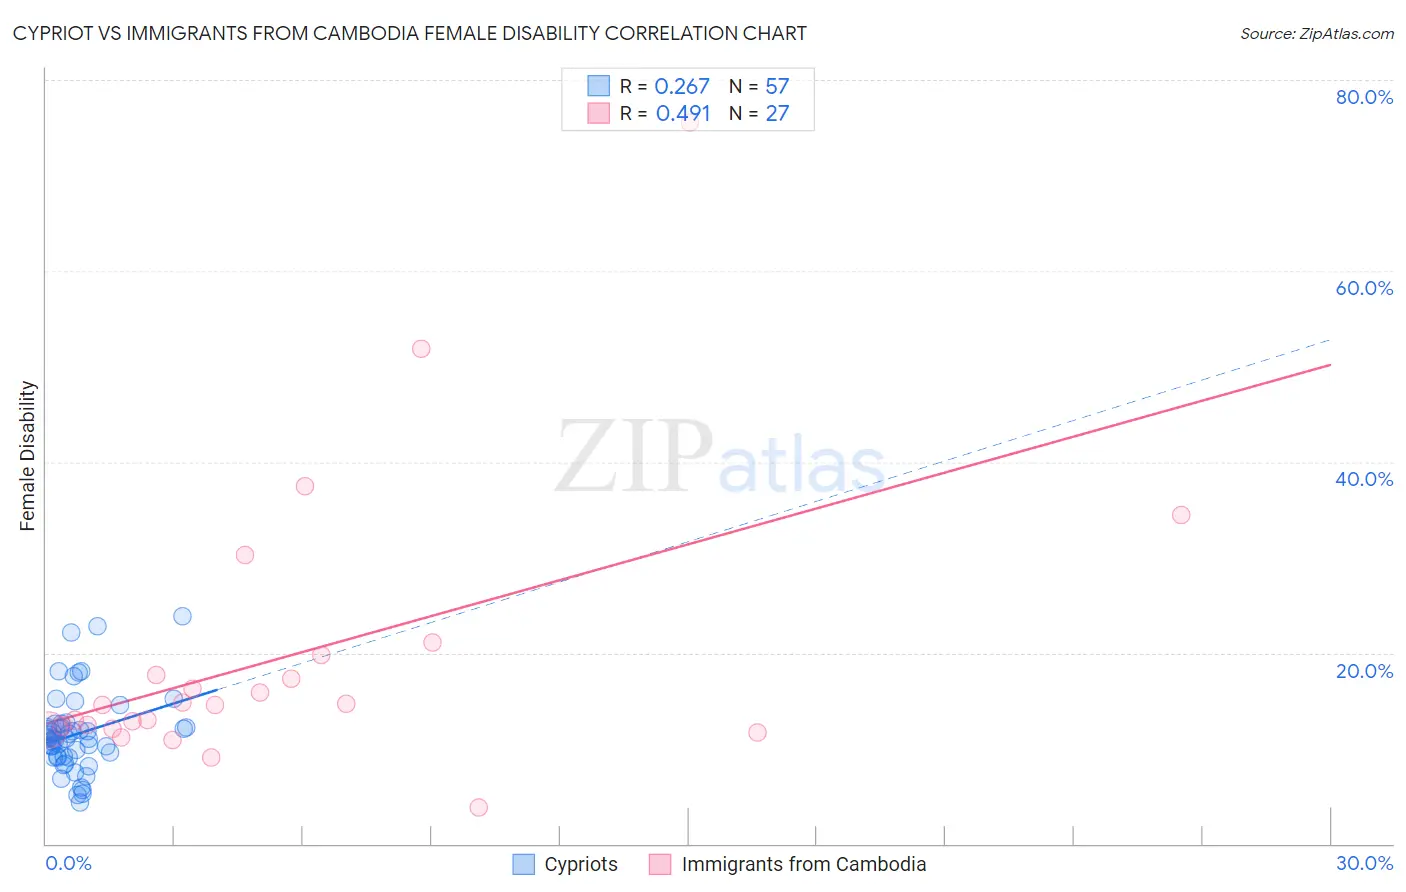
Cypriot vs Immigrants from Cambodia Female Disability Correlation Chart
The statistical analysis conducted on geographies consisting of 61,870,589 people shows a weak positive correlation between the proportion of Cypriots and percentage of females with a disability in the United States with a correlation coefficient (R) of 0.267 and weighted average of 11.2%. Similarly, the statistical analysis conducted on geographies consisting of 205,152,256 people shows a moderate positive correlation between the proportion of Immigrants from Cambodia and percentage of females with a disability in the United States with a correlation coefficient (R) of 0.491 and weighted average of 12.5%, a difference of 11.5%.
Female Disability Correlation Summary
| Measurement | Cypriot | Immigrants from Cambodia |
| Minimum | 4.4% | 3.8% |
| Maximum | 23.8% | 75.5% |
| Range | 19.4% | 71.7% |
| Mean | 11.5% | 19.6% |
| Median | 11.1% | 14.5% |
| Interquartile 25% (IQ1) | 9.1% | 12.0% |
| Interquartile 75% (IQ3) | 12.4% | 19.8% |
| Interquartile Range (IQR) | 3.3% | 7.8% |
| Standard Deviation (Sample) | 4.1% | 15.0% |
| Standard Deviation (Population) | 4.1% | 14.8% |
Similar Demographics by Female Disability
Demographics Similar to Cypriots by Female Disability
In terms of female disability, the demographic groups most similar to Cypriots are Ethiopian (11.2%, a difference of 0.010%), Immigrants from Ethiopia (11.2%, a difference of 0.040%), Immigrants from Japan (11.2%, a difference of 0.070%), Immigrants from Indonesia (11.2%, a difference of 0.21%), and Immigrants from Lithuania (11.2%, a difference of 0.25%).
| Demographics | Rating | Rank | Female Disability |
| Immigrants | Malaysia | 100.0 /100 | #29 | Exceptional 11.1% |
| Turks | 100.0 /100 | #30 | Exceptional 11.1% |
| Immigrants | Kuwait | 100.0 /100 | #31 | Exceptional 11.1% |
| Immigrants | Australia | 100.0 /100 | #32 | Exceptional 11.1% |
| Immigrants | Egypt | 100.0 /100 | #33 | Exceptional 11.1% |
| Immigrants | Indonesia | 100.0 /100 | #34 | Exceptional 11.2% |
| Immigrants | Japan | 100.0 /100 | #35 | Exceptional 11.2% |
| Cypriots | 100.0 /100 | #36 | Exceptional 11.2% |
| Ethiopians | 100.0 /100 | #37 | Exceptional 11.2% |
| Immigrants | Ethiopia | 100.0 /100 | #38 | Exceptional 11.2% |
| Immigrants | Lithuania | 100.0 /100 | #39 | Exceptional 11.2% |
| Mongolians | 100.0 /100 | #40 | Exceptional 11.2% |
| Paraguayans | 100.0 /100 | #41 | Exceptional 11.2% |
| Israelis | 100.0 /100 | #42 | Exceptional 11.2% |
| Afghans | 100.0 /100 | #43 | Exceptional 11.2% |
Demographics Similar to Immigrants from Cambodia by Female Disability
In terms of female disability, the demographic groups most similar to Immigrants from Cambodia are Hispanic or Latino (12.5%, a difference of 0.030%), Assyrian/Chaldean/Syriac (12.5%, a difference of 0.030%), Hungarian (12.5%, a difference of 0.070%), Polish (12.5%, a difference of 0.080%), and Immigrants from Belize (12.5%, a difference of 0.11%).
| Demographics | Rating | Rank | Female Disability |
| Native Hawaiians | 10.8 /100 | #221 | Poor 12.4% |
| Italians | 10.7 /100 | #222 | Poor 12.4% |
| Guamanians/Chamorros | 9.5 /100 | #223 | Tragic 12.5% |
| Belizeans | 9.3 /100 | #224 | Tragic 12.5% |
| Poles | 8.4 /100 | #225 | Tragic 12.5% |
| Hispanics or Latinos | 8.0 /100 | #226 | Tragic 12.5% |
| Assyrians/Chaldeans/Syriacs | 8.0 /100 | #227 | Tragic 12.5% |
| Immigrants | Cambodia | 7.8 /100 | #228 | Tragic 12.5% |
| Hungarians | 7.2 /100 | #229 | Tragic 12.5% |
| Immigrants | Belize | 7.0 /100 | #230 | Tragic 12.5% |
| Belgians | 6.5 /100 | #231 | Tragic 12.5% |
| Immigrants | Somalia | 5.9 /100 | #232 | Tragic 12.5% |
| Immigrants | Iraq | 5.3 /100 | #233 | Tragic 12.5% |
| Scandinavians | 5.3 /100 | #234 | Tragic 12.5% |
| Malaysians | 5.0 /100 | #235 | Tragic 12.5% |