Nepalese vs Immigrants from Cambodia In Labor Force | Age 35-44
COMPARE
Nepalese
Immigrants from Cambodia
In Labor Force | Age 35-44
In Labor Force | Age 35-44 Comparison
Nepalese
Immigrants from Cambodia
82.4%
IN LABOR FORCE | AGE 35-44
0.0/ 100
METRIC RATING
303rd/ 347
METRIC RANK
83.8%
IN LABOR FORCE | AGE 35-44
1.1/ 100
METRIC RATING
242nd/ 347
METRIC RANK
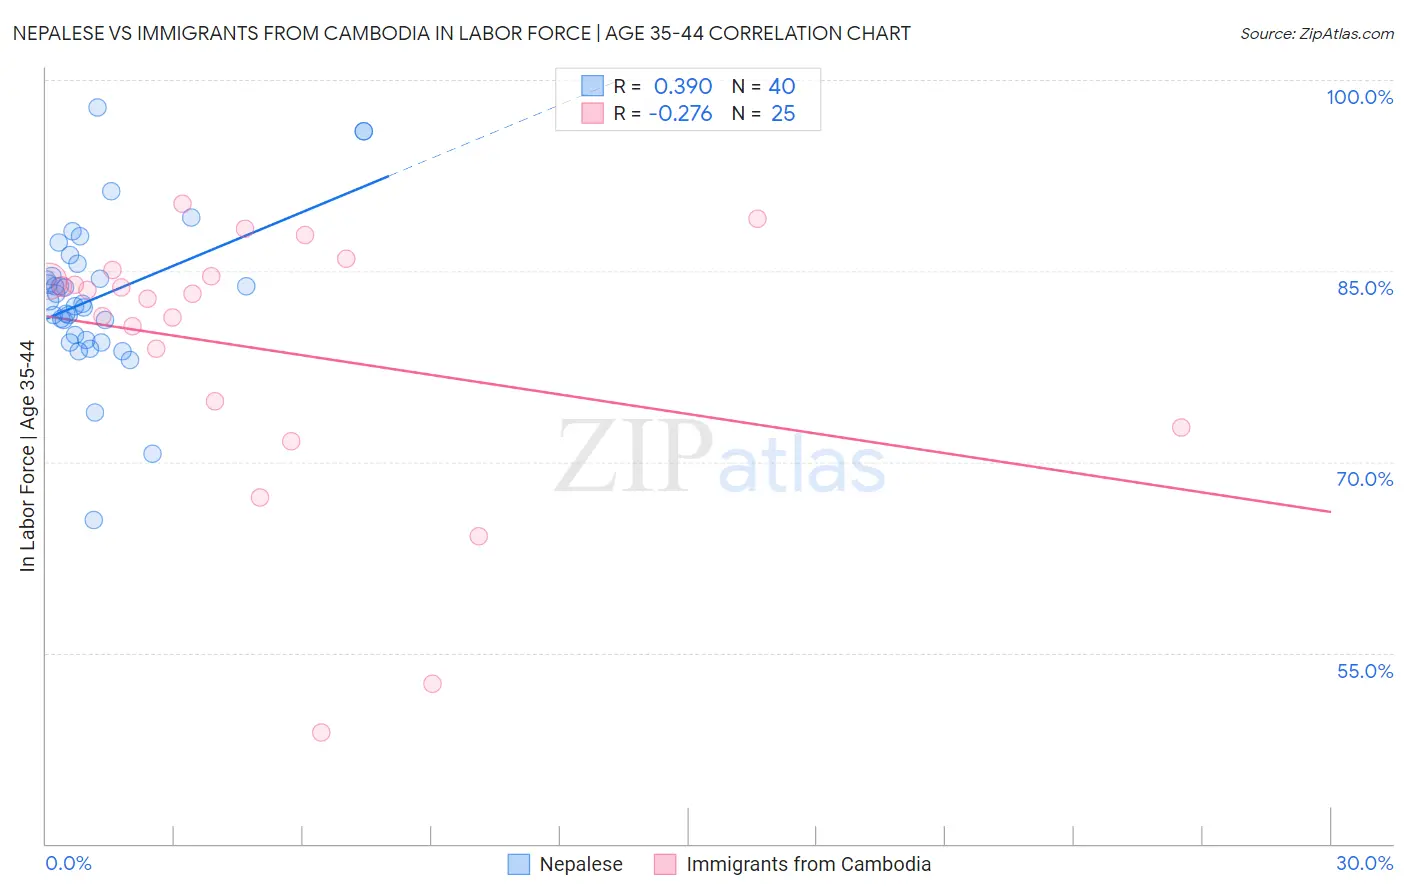
Nepalese vs Immigrants from Cambodia In Labor Force | Age 35-44 Correlation Chart
The statistical analysis conducted on geographies consisting of 24,521,755 people shows a mild positive correlation between the proportion of Nepalese and labor force participation rate among population between the ages 35 and 44 in the United States with a correlation coefficient (R) of 0.390 and weighted average of 82.4%. Similarly, the statistical analysis conducted on geographies consisting of 205,131,039 people shows a weak negative correlation between the proportion of Immigrants from Cambodia and labor force participation rate among population between the ages 35 and 44 in the United States with a correlation coefficient (R) of -0.276 and weighted average of 83.8%, a difference of 1.6%.
In Labor Force | Age 35-44 Correlation Summary
| Measurement | Nepalese | Immigrants from Cambodia |
| Minimum | 65.4% | 48.7% |
| Maximum | 97.8% | 90.3% |
| Range | 32.4% | 41.6% |
| Mean | 83.0% | 78.8% |
| Median | 82.5% | 83.2% |
| Interquartile 25% (IQ1) | 79.8% | 73.7% |
| Interquartile 75% (IQ3) | 85.1% | 84.8% |
| Interquartile Range (IQR) | 5.3% | 11.1% |
| Standard Deviation (Sample) | 6.1% | 10.7% |
| Standard Deviation (Population) | 6.0% | 10.5% |
Similar Demographics by In Labor Force | Age 35-44
Demographics Similar to Nepalese by In Labor Force | Age 35-44
In terms of in labor force | age 35-44, the demographic groups most similar to Nepalese are American (82.4%, a difference of 0.0%), Marshallese (82.4%, a difference of 0.010%), Spanish American Indian (82.5%, a difference of 0.080%), Central American Indian (82.5%, a difference of 0.10%), and Tlingit-Haida (82.5%, a difference of 0.16%).
| Demographics | Rating | Rank | In Labor Force | Age 35-44 |
| Mexican American Indians | 0.0 /100 | #296 | Tragic 82.6% |
| Hmong | 0.0 /100 | #297 | Tragic 82.6% |
| Ottawa | 0.0 /100 | #298 | Tragic 82.6% |
| Tlingit-Haida | 0.0 /100 | #299 | Tragic 82.5% |
| Central American Indians | 0.0 /100 | #300 | Tragic 82.5% |
| Spanish American Indians | 0.0 /100 | #301 | Tragic 82.5% |
| Americans | 0.0 /100 | #302 | Tragic 82.4% |
| Nepalese | 0.0 /100 | #303 | Tragic 82.4% |
| Marshallese | 0.0 /100 | #304 | Tragic 82.4% |
| Shoshone | 0.0 /100 | #305 | Tragic 82.2% |
| Blacks/African Americans | 0.0 /100 | #306 | Tragic 82.2% |
| Hispanics or Latinos | 0.0 /100 | #307 | Tragic 82.1% |
| Immigrants | Central America | 0.0 /100 | #308 | Tragic 82.0% |
| Cree | 0.0 /100 | #309 | Tragic 82.0% |
| Blackfeet | 0.0 /100 | #310 | Tragic 81.9% |
Demographics Similar to Immigrants from Cambodia by In Labor Force | Age 35-44
In terms of in labor force | age 35-44, the demographic groups most similar to Immigrants from Cambodia are Immigrants from Western Asia (83.8%, a difference of 0.0%), Guyanese (83.8%, a difference of 0.010%), Malaysian (83.8%, a difference of 0.010%), Iraqi (83.8%, a difference of 0.020%), and Immigrants (83.7%, a difference of 0.020%).
| Demographics | Rating | Rank | In Labor Force | Age 35-44 |
| Immigrants | Syria | 2.5 /100 | #235 | Tragic 83.9% |
| West Indians | 2.4 /100 | #236 | Tragic 83.9% |
| English | 1.8 /100 | #237 | Tragic 83.8% |
| Immigrants | Laos | 1.7 /100 | #238 | Tragic 83.8% |
| Celtics | 1.4 /100 | #239 | Tragic 83.8% |
| Arabs | 1.3 /100 | #240 | Tragic 83.8% |
| Iraqis | 1.3 /100 | #241 | Tragic 83.8% |
| Immigrants | Cambodia | 1.1 /100 | #242 | Tragic 83.8% |
| Immigrants | Western Asia | 1.1 /100 | #243 | Tragic 83.8% |
| Guyanese | 1.1 /100 | #244 | Tragic 83.8% |
| Malaysians | 1.1 /100 | #245 | Tragic 83.8% |
| Immigrants | Immigrants | 1.0 /100 | #246 | Tragic 83.7% |
| Immigrants | Armenia | 0.9 /100 | #247 | Tragic 83.7% |
| Indonesians | 0.8 /100 | #248 | Tragic 83.7% |
| Immigrants | St. Vincent and the Grenadines | 0.7 /100 | #249 | Tragic 83.7% |