Navajo vs Italian Average Family Size
COMPARE
Navajo
Italian
Average Family Size
Average Family Size Comparison
Navajo
Italians
3.65
AVERAGE FAMILY SIZE
100.0/ 100
METRIC RATING
5th/ 347
METRIC RANK
3.12
AVERAGE FAMILY SIZE
0.1/ 100
METRIC RATING
317th/ 347
METRIC RANK
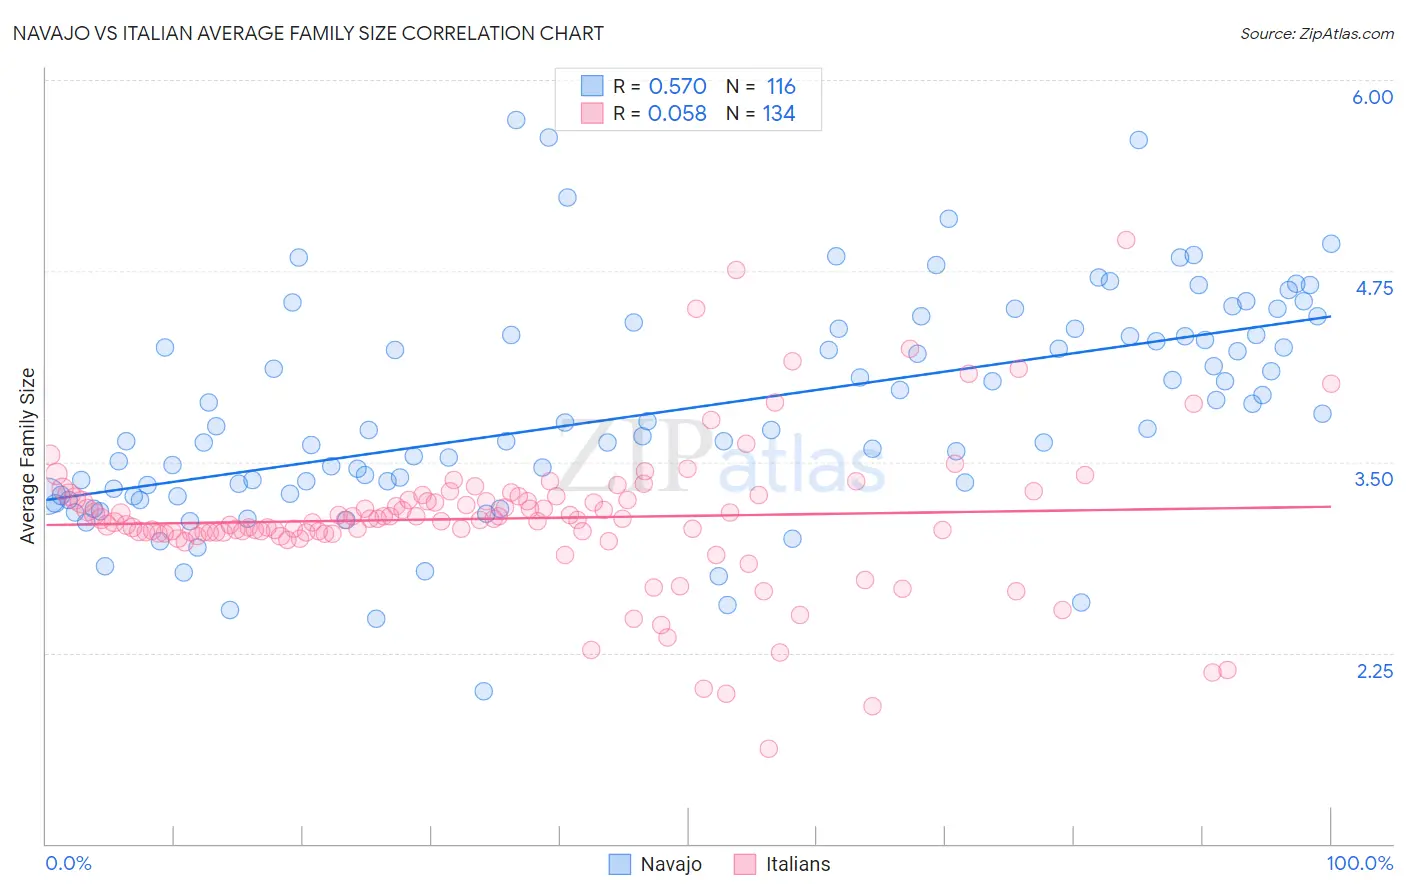
Navajo vs Italian Average Family Size Correlation Chart
The statistical analysis conducted on geographies consisting of 224,751,330 people shows a substantial positive correlation between the proportion of Navajo and average family size in the United States with a correlation coefficient (R) of 0.570 and weighted average of 3.65. Similarly, the statistical analysis conducted on geographies consisting of 574,452,986 people shows a slight positive correlation between the proportion of Italians and average family size in the United States with a correlation coefficient (R) of 0.058 and weighted average of 3.12, a difference of 16.9%.
Average Family Size Correlation Summary
| Measurement | Navajo | Italian |
| Minimum | 2.00 | 1.62 |
| Maximum | 5.74 | 4.95 |
| Range | 3.74 | 3.33 |
| Mean | 3.83 | 3.13 |
| Median | 3.71 | 3.12 |
| Interquartile 25% (IQ1) | 3.31 | 3.04 |
| Interquartile 75% (IQ3) | 4.33 | 3.26 |
| Interquartile Range (IQR) | 1.03 | 0.22 |
| Standard Deviation (Sample) | 0.71 | 0.47 |
| Standard Deviation (Population) | 0.71 | 0.47 |
Similar Demographics by Average Family Size
Demographics Similar to Navajo by Average Family Size
In terms of average family size, the demographic groups most similar to Navajo are Arapaho (3.64, a difference of 0.27%), Inupiat (3.63, a difference of 0.48%), Immigrants from Yemen (3.60, a difference of 1.3%), Hopi (3.60, a difference of 1.4%), and Spanish American Indian (3.58, a difference of 1.7%).
| Demographics | Rating | Rank | Average Family Size |
| Yup'ik | 100 /100 | #1 | Exceptional 4.00 |
| Crow | 100 /100 | #2 | Exceptional 3.82 |
| Pueblo | 100 /100 | #3 | Exceptional 3.79 |
| Pima | 100 /100 | #4 | Exceptional 3.75 |
| Navajo | 100.0 /100 | #5 | Exceptional 3.65 |
| Arapaho | 100.0 /100 | #6 | Exceptional 3.64 |
| Inupiat | 100.0 /100 | #7 | Exceptional 3.63 |
| Immigrants | Yemen | 100.0 /100 | #8 | Exceptional 3.60 |
| Hopi | 100.0 /100 | #9 | Exceptional 3.60 |
| Spanish American Indians | 100.0 /100 | #10 | Exceptional 3.58 |
| Tohono O'odham | 100.0 /100 | #11 | Exceptional 3.53 |
| Immigrants | Mexico | 100.0 /100 | #12 | Exceptional 3.52 |
| Sioux | 100.0 /100 | #13 | Exceptional 3.52 |
| Immigrants | Central America | 100.0 /100 | #14 | Exceptional 3.49 |
| Tongans | 100.0 /100 | #15 | Exceptional 3.49 |
Demographics Similar to Italians by Average Family Size
In terms of average family size, the demographic groups most similar to Italians are Eastern European (3.12, a difference of 0.010%), Welsh (3.12, a difference of 0.010%), Serbian (3.12, a difference of 0.060%), Immigrants from North America (3.12, a difference of 0.080%), and Immigrants from Austria (3.12, a difference of 0.11%).
| Demographics | Rating | Rank | Average Family Size |
| Czechoslovakians | 0.1 /100 | #310 | Tragic 3.13 |
| Immigrants | Northern Europe | 0.1 /100 | #311 | Tragic 3.13 |
| Immigrants | Australia | 0.1 /100 | #312 | Tragic 3.13 |
| Bulgarians | 0.1 /100 | #313 | Tragic 3.13 |
| Russians | 0.1 /100 | #314 | Tragic 3.12 |
| Immigrants | Scotland | 0.1 /100 | #315 | Tragic 3.12 |
| Serbians | 0.1 /100 | #316 | Tragic 3.12 |
| Italians | 0.1 /100 | #317 | Tragic 3.12 |
| Eastern Europeans | 0.1 /100 | #318 | Tragic 3.12 |
| Welsh | 0.1 /100 | #319 | Tragic 3.12 |
| Immigrants | North America | 0.0 /100 | #320 | Tragic 3.12 |
| Immigrants | Austria | 0.0 /100 | #321 | Tragic 3.12 |
| Immigrants | Canada | 0.0 /100 | #322 | Tragic 3.12 |
| Soviet Union | 0.0 /100 | #323 | Tragic 3.11 |
| Celtics | 0.0 /100 | #324 | Tragic 3.11 |