Navajo vs Danish Cognitive Disability
COMPARE
Navajo
Danish
Cognitive Disability
Cognitive Disability Comparison
Navajo
Danes
18.8%
COGNITIVE DISABILITY
0.0/ 100
METRIC RATING
329th/ 347
METRIC RANK
16.7%
COGNITIVE DISABILITY
98.8/ 100
METRIC RATING
91st/ 347
METRIC RANK
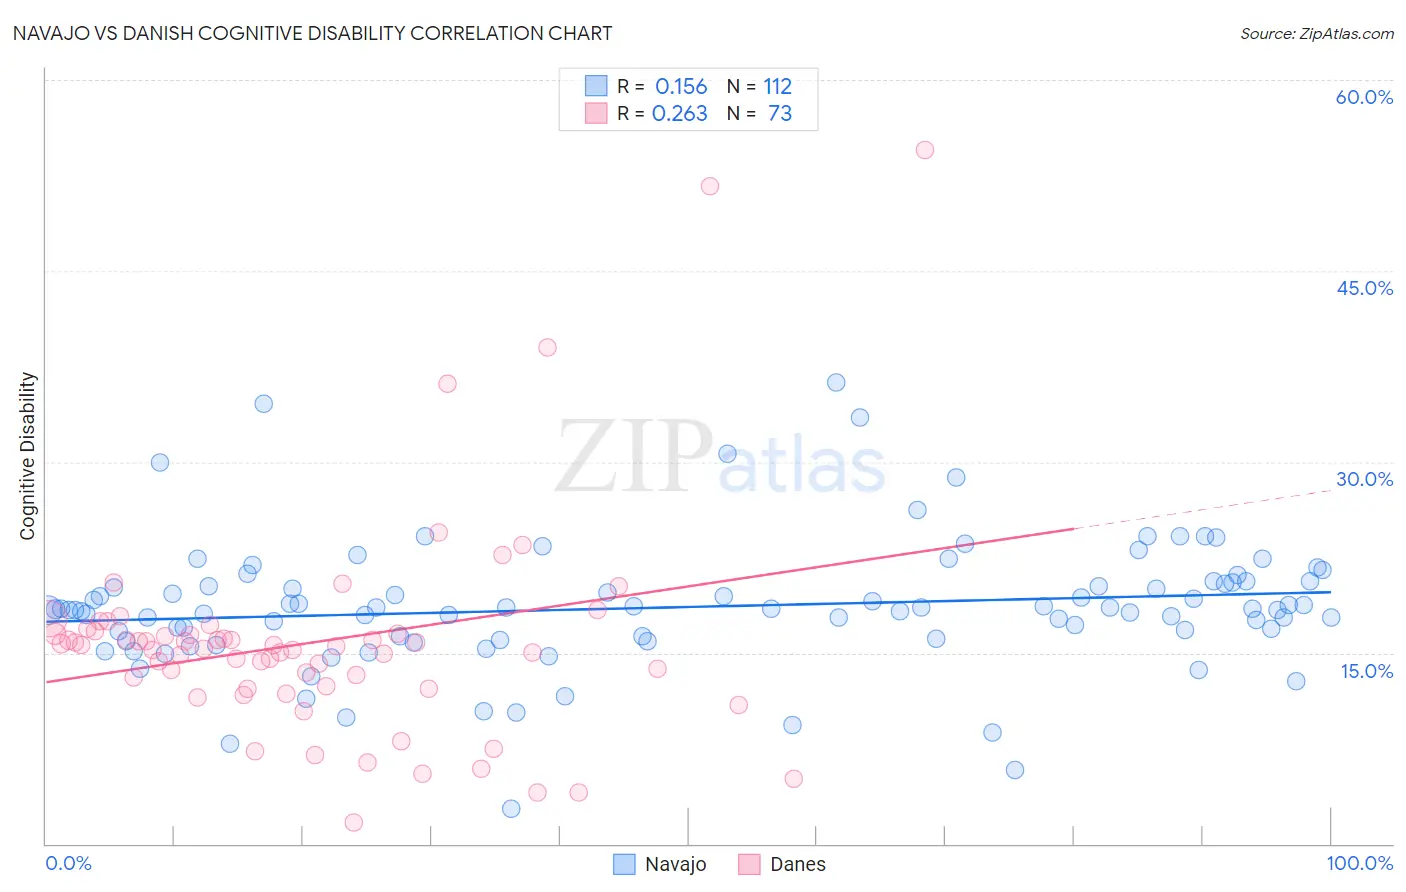
Navajo vs Danish Cognitive Disability Correlation Chart
The statistical analysis conducted on geographies consisting of 224,779,988 people shows a poor positive correlation between the proportion of Navajo and percentage of population with cognitive disability in the United States with a correlation coefficient (R) of 0.156 and weighted average of 18.8%. Similarly, the statistical analysis conducted on geographies consisting of 474,128,115 people shows a weak positive correlation between the proportion of Danes and percentage of population with cognitive disability in the United States with a correlation coefficient (R) of 0.263 and weighted average of 16.7%, a difference of 12.1%.
Cognitive Disability Correlation Summary
| Measurement | Navajo | Danish |
| Minimum | 2.7% | 1.7% |
| Maximum | 36.3% | 54.5% |
| Range | 33.6% | 52.9% |
| Mean | 18.6% | 15.8% |
| Median | 18.4% | 15.5% |
| Interquartile 25% (IQ1) | 16.2% | 12.3% |
| Interquartile 75% (IQ3) | 20.5% | 16.6% |
| Interquartile Range (IQR) | 4.3% | 4.3% |
| Standard Deviation (Sample) | 5.1% | 8.6% |
| Standard Deviation (Population) | 5.1% | 8.6% |
Similar Demographics by Cognitive Disability
Demographics Similar to Navajo by Cognitive Disability
In terms of cognitive disability, the demographic groups most similar to Navajo are Immigrants from Dominican Republic (18.8%, a difference of 0.10%), Pima (18.8%, a difference of 0.16%), Immigrants from Sudan (18.8%, a difference of 0.18%), Kiowa (18.7%, a difference of 0.22%), and Immigrants from Yemen (18.8%, a difference of 0.24%).
| Demographics | Rating | Rank | Cognitive Disability |
| Immigrants | Liberia | 0.0 /100 | #322 | Tragic 18.7% |
| Pueblo | 0.0 /100 | #323 | Tragic 18.7% |
| Dominicans | 0.0 /100 | #324 | Tragic 18.7% |
| Indonesians | 0.0 /100 | #325 | Tragic 18.7% |
| Immigrants | Senegal | 0.0 /100 | #326 | Tragic 18.7% |
| U.S. Virgin Islanders | 0.0 /100 | #327 | Tragic 18.7% |
| Kiowa | 0.0 /100 | #328 | Tragic 18.7% |
| Navajo | 0.0 /100 | #329 | Tragic 18.8% |
| Immigrants | Dominican Republic | 0.0 /100 | #330 | Tragic 18.8% |
| Pima | 0.0 /100 | #331 | Tragic 18.8% |
| Immigrants | Sudan | 0.0 /100 | #332 | Tragic 18.8% |
| Immigrants | Yemen | 0.0 /100 | #333 | Tragic 18.8% |
| Sudanese | 0.0 /100 | #334 | Tragic 18.9% |
| Senegalese | 0.0 /100 | #335 | Tragic 19.0% |
| Blacks/African Americans | 0.0 /100 | #336 | Tragic 19.0% |
Demographics Similar to Danes by Cognitive Disability
In terms of cognitive disability, the demographic groups most similar to Danes are Immigrants from Egypt (16.7%, a difference of 0.010%), South American (16.7%, a difference of 0.010%), Immigrants from South America (16.7%, a difference of 0.010%), Immigrants from Southern Europe (16.7%, a difference of 0.020%), and Asian (16.7%, a difference of 0.060%).
| Demographics | Rating | Rank | Cognitive Disability |
| Belgians | 99.1 /100 | #84 | Exceptional 16.7% |
| Immigrants | Moldova | 99.1 /100 | #85 | Exceptional 16.7% |
| Immigrants | South Africa | 99.0 /100 | #86 | Exceptional 16.7% |
| Native Hawaiians | 99.0 /100 | #87 | Exceptional 16.7% |
| Immigrants | Philippines | 99.0 /100 | #88 | Exceptional 16.7% |
| Immigrants | Egypt | 98.8 /100 | #89 | Exceptional 16.7% |
| South Americans | 98.8 /100 | #90 | Exceptional 16.7% |
| Danes | 98.8 /100 | #91 | Exceptional 16.7% |
| Immigrants | South America | 98.8 /100 | #92 | Exceptional 16.7% |
| Immigrants | Southern Europe | 98.7 /100 | #93 | Exceptional 16.7% |
| Asians | 98.7 /100 | #94 | Exceptional 16.7% |
| English | 98.6 /100 | #95 | Exceptional 16.8% |
| Finns | 98.5 /100 | #96 | Exceptional 16.8% |
| Dutch | 98.5 /100 | #97 | Exceptional 16.8% |
| Immigrants | Lebanon | 98.4 /100 | #98 | Exceptional 16.8% |