Navajo vs Danish In Labor Force | Age 20-24
COMPARE
Navajo
Danish
In Labor Force | Age 20-24
In Labor Force | Age 20-24 Comparison
Navajo
Danes
64.8%
IN LABOR FORCE | AGE 20-24
0.0/ 100
METRIC RATING
347th/ 347
METRIC RANK
79.0%
IN LABOR FORCE | AGE 20-24
100.0/ 100
METRIC RATING
6th/ 347
METRIC RANK
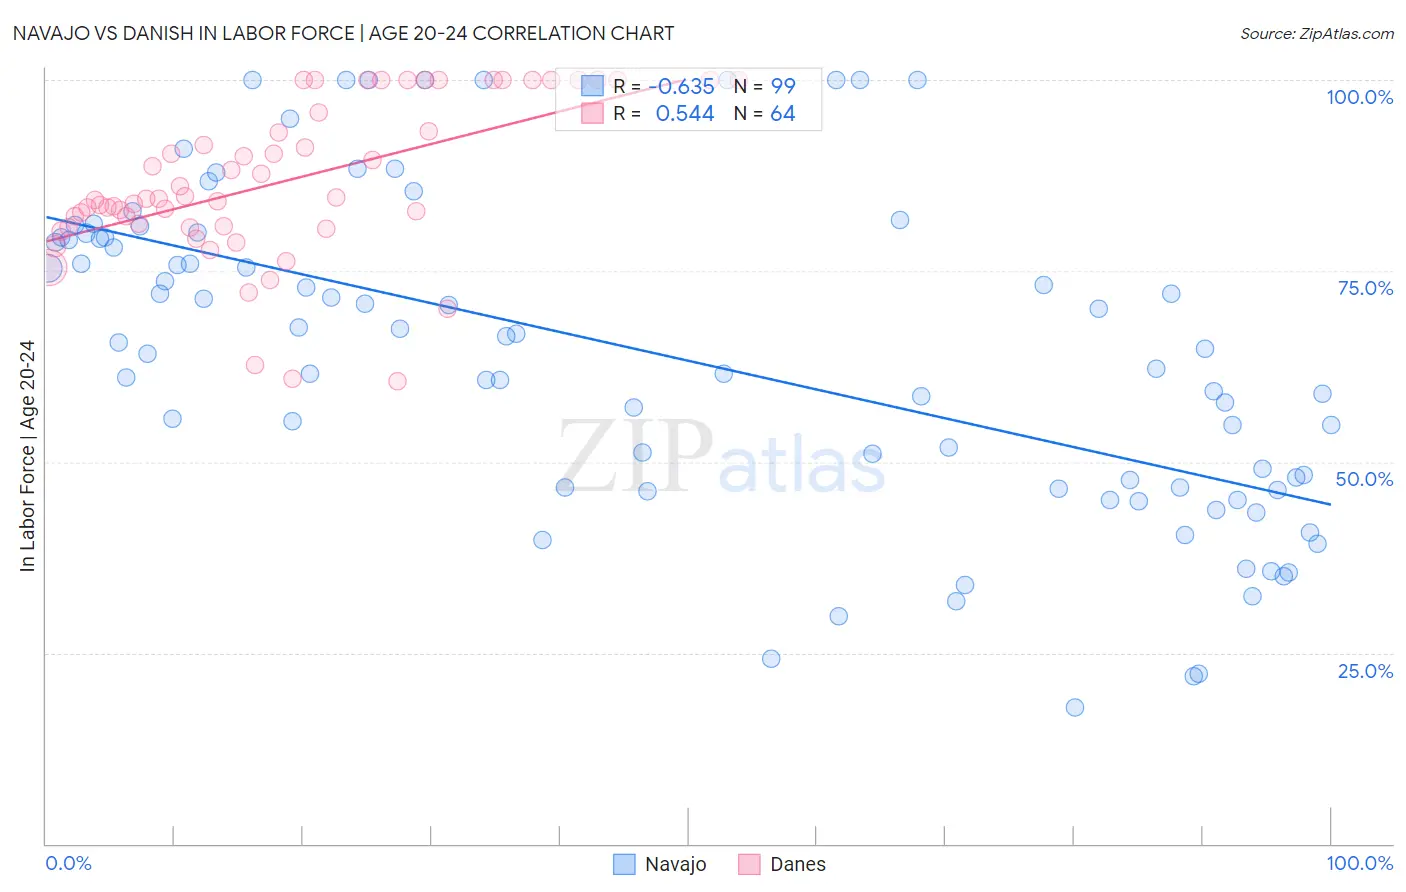
Navajo vs Danish In Labor Force | Age 20-24 Correlation Chart
The statistical analysis conducted on geographies consisting of 224,781,788 people shows a significant negative correlation between the proportion of Navajo and labor force participation rate among population between the ages 20 and 24 in the United States with a correlation coefficient (R) of -0.635 and weighted average of 64.8%. Similarly, the statistical analysis conducted on geographies consisting of 473,606,493 people shows a substantial positive correlation between the proportion of Danes and labor force participation rate among population between the ages 20 and 24 in the United States with a correlation coefficient (R) of 0.544 and weighted average of 79.0%, a difference of 21.8%.
In Labor Force | Age 20-24 Correlation Summary
| Measurement | Navajo | Danish |
| Minimum | 17.9% | 60.6% |
| Maximum | 100.0% | 100.0% |
| Range | 82.1% | 39.4% |
| Mean | 63.8% | 86.7% |
| Median | 64.7% | 84.5% |
| Interquartile 25% (IQ1) | 46.6% | 80.8% |
| Interquartile 75% (IQ3) | 79.4% | 97.9% |
| Interquartile Range (IQR) | 32.8% | 17.1% |
| Standard Deviation (Sample) | 21.0% | 10.2% |
| Standard Deviation (Population) | 20.9% | 10.1% |
Similar Demographics by In Labor Force | Age 20-24
Demographics Similar to Navajo by In Labor Force | Age 20-24
In terms of in labor force | age 20-24, the demographic groups most similar to Navajo are Lumbee (65.5%, a difference of 1.1%), Hopi (66.0%, a difference of 1.8%), Immigrants from Grenada (67.2%, a difference of 3.6%), Puerto Rican (68.3%, a difference of 5.4%), and Immigrants from St. Vincent and the Grenadines (68.4%, a difference of 5.5%).
| Demographics | Rating | Rank | In Labor Force | Age 20-24 |
| Yuman | 0.0 /100 | #333 | Tragic 70.3% |
| British West Indians | 0.0 /100 | #334 | Tragic 70.0% |
| Immigrants | Barbados | 0.0 /100 | #335 | Tragic 69.7% |
| Immigrants | Guyana | 0.0 /100 | #336 | Tragic 69.3% |
| Guyanese | 0.0 /100 | #337 | Tragic 69.2% |
| Pima | 0.0 /100 | #338 | Tragic 69.0% |
| Immigrants | Yemen | 0.0 /100 | #339 | Tragic 68.9% |
| Menominee | 0.0 /100 | #340 | Tragic 68.7% |
| Tohono O'odham | 0.0 /100 | #341 | Tragic 68.6% |
| Immigrants | St. Vincent and the Grenadines | 0.0 /100 | #342 | Tragic 68.4% |
| Puerto Ricans | 0.0 /100 | #343 | Tragic 68.3% |
| Immigrants | Grenada | 0.0 /100 | #344 | Tragic 67.2% |
| Hopi | 0.0 /100 | #345 | Tragic 66.0% |
| Lumbee | 0.0 /100 | #346 | Tragic 65.5% |
| Navajo | 0.0 /100 | #347 | Tragic 64.8% |
Demographics Similar to Danes by In Labor Force | Age 20-24
In terms of in labor force | age 20-24, the demographic groups most similar to Danes are Aleut (79.0%, a difference of 0.010%), Luxembourger (79.0%, a difference of 0.040%), Alaskan Athabascan (79.1%, a difference of 0.15%), Immigrants from Cabo Verde (78.9%, a difference of 0.15%), and Swedish (78.8%, a difference of 0.21%).
| Demographics | Rating | Rank | In Labor Force | Age 20-24 |
| Norwegians | 100.0 /100 | #1 | Exceptional 80.1% |
| Immigrants | Somalia | 100.0 /100 | #2 | Exceptional 79.5% |
| Somalis | 100.0 /100 | #3 | Exceptional 79.3% |
| Alaskan Athabascans | 100.0 /100 | #4 | Exceptional 79.1% |
| Aleuts | 100.0 /100 | #5 | Exceptional 79.0% |
| Danes | 100.0 /100 | #6 | Exceptional 79.0% |
| Luxembourgers | 100.0 /100 | #7 | Exceptional 79.0% |
| Immigrants | Cabo Verde | 100.0 /100 | #8 | Exceptional 78.9% |
| Swedes | 100.0 /100 | #9 | Exceptional 78.8% |
| Slovenes | 100.0 /100 | #10 | Exceptional 78.7% |
| Finns | 100.0 /100 | #11 | Exceptional 78.7% |
| Germans | 100.0 /100 | #12 | Exceptional 78.6% |
| Scandinavians | 100.0 /100 | #13 | Exceptional 78.5% |
| Czechs | 100.0 /100 | #14 | Exceptional 78.5% |
| Sudanese | 100.0 /100 | #15 | Exceptional 78.4% |