Immigrants from Argentina vs Ottawa Disability Age Over 75
COMPARE
Immigrants from Argentina
Ottawa
Disability Age Over 75
Disability Age Over 75 Comparison
Immigrants from Argentina
Ottawa
45.9%
DISABILITY AGE OVER 75
99.6/ 100
METRIC RATING
61st/ 347
METRIC RANK
47.6%
DISABILITY AGE OVER 75
28.1/ 100
METRIC RATING
193rd/ 347
METRIC RANK
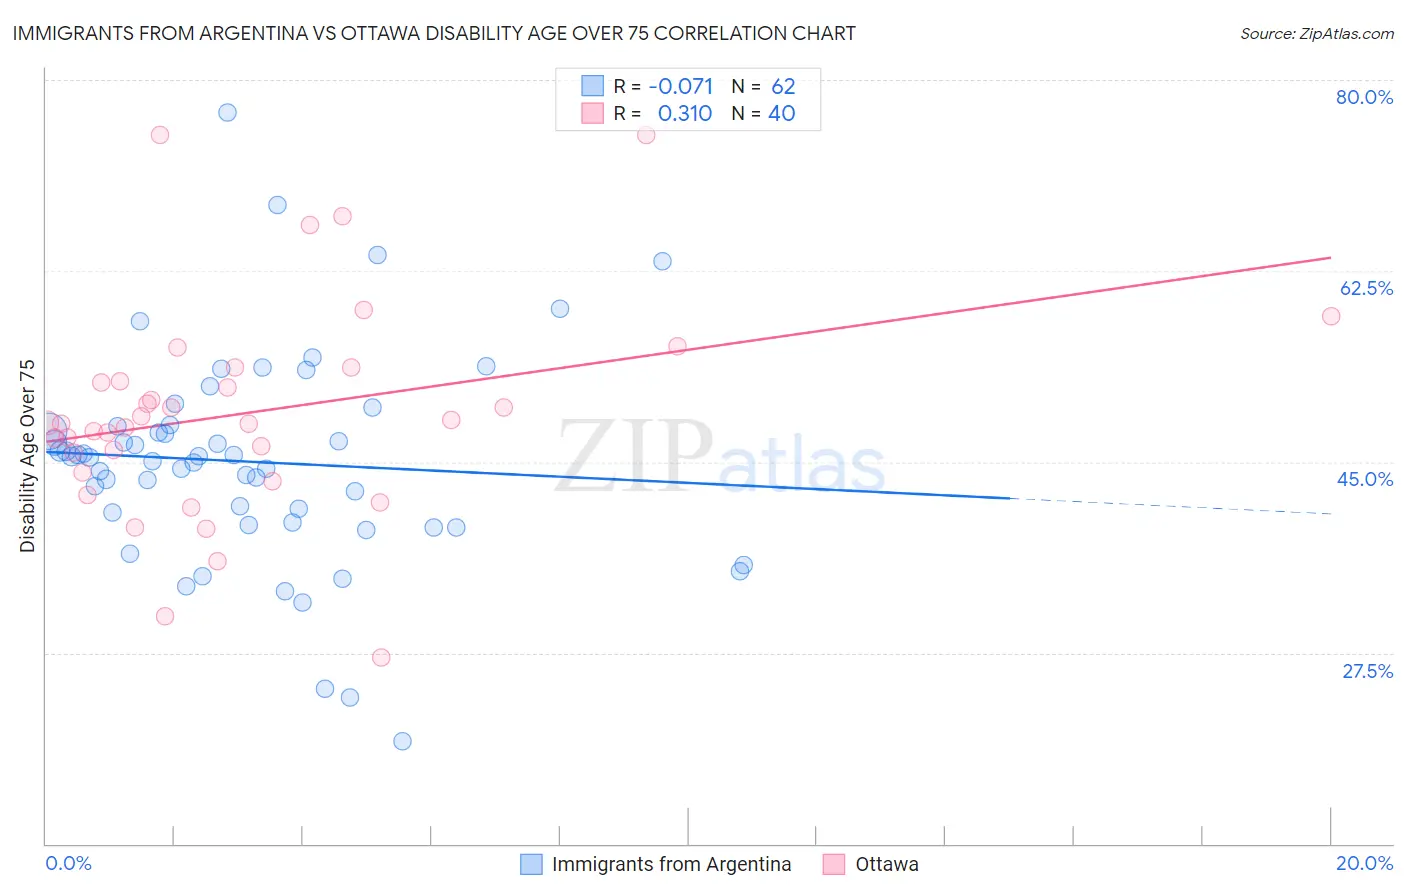
Immigrants from Argentina vs Ottawa Disability Age Over 75 Correlation Chart
The statistical analysis conducted on geographies consisting of 264,260,821 people shows a slight negative correlation between the proportion of Immigrants from Argentina and percentage of population with a disability over the age of 75 in the United States with a correlation coefficient (R) of -0.071 and weighted average of 45.9%. Similarly, the statistical analysis conducted on geographies consisting of 49,925,299 people shows a mild positive correlation between the proportion of Ottawa and percentage of population with a disability over the age of 75 in the United States with a correlation coefficient (R) of 0.310 and weighted average of 47.6%, a difference of 3.7%.
Disability Age Over 75 Correlation Summary
| Measurement | Immigrants from Argentina | Ottawa |
| Minimum | 19.4% | 27.1% |
| Maximum | 77.0% | 75.0% |
| Range | 57.6% | 47.9% |
| Mean | 45.0% | 49.5% |
| Median | 45.4% | 48.6% |
| Interquartile 25% (IQ1) | 39.5% | 44.9% |
| Interquartile 75% (IQ3) | 48.2% | 53.0% |
| Interquartile Range (IQR) | 8.7% | 8.1% |
| Standard Deviation (Sample) | 9.9% | 9.9% |
| Standard Deviation (Population) | 9.8% | 9.7% |
Similar Demographics by Disability Age Over 75
Demographics Similar to Immigrants from Argentina by Disability Age Over 75
In terms of disability age over 75, the demographic groups most similar to Immigrants from Argentina are Iranian (45.9%, a difference of 0.020%), Immigrants from Europe (45.9%, a difference of 0.020%), Immigrants from Israel (45.9%, a difference of 0.030%), Burmese (45.9%, a difference of 0.030%), and Immigrants from Turkey (45.9%, a difference of 0.040%).
| Demographics | Rating | Rank | Disability Age Over 75 |
| Slovaks | 99.6 /100 | #54 | Exceptional 45.8% |
| Maltese | 99.6 /100 | #55 | Exceptional 45.8% |
| Immigrants | Netherlands | 99.6 /100 | #56 | Exceptional 45.9% |
| Immigrants | Turkey | 99.6 /100 | #57 | Exceptional 45.9% |
| Immigrants | Israel | 99.6 /100 | #58 | Exceptional 45.9% |
| Iranians | 99.6 /100 | #59 | Exceptional 45.9% |
| Immigrants | Europe | 99.6 /100 | #60 | Exceptional 45.9% |
| Immigrants | Argentina | 99.6 /100 | #61 | Exceptional 45.9% |
| Burmese | 99.5 /100 | #62 | Exceptional 45.9% |
| Immigrants | Norway | 99.5 /100 | #63 | Exceptional 45.9% |
| Immigrants | North Macedonia | 99.5 /100 | #64 | Exceptional 45.9% |
| Austrians | 99.5 /100 | #65 | Exceptional 46.0% |
| Immigrants | England | 99.5 /100 | #66 | Exceptional 46.0% |
| Immigrants | Spain | 99.4 /100 | #67 | Exceptional 46.0% |
| Immigrants | South Central Asia | 99.4 /100 | #68 | Exceptional 46.0% |
Demographics Similar to Ottawa by Disability Age Over 75
In terms of disability age over 75, the demographic groups most similar to Ottawa are Immigrants from Jamaica (47.6%, a difference of 0.0%), Portuguese (47.6%, a difference of 0.030%), Somali (47.6%, a difference of 0.040%), Immigrants from Lebanon (47.6%, a difference of 0.050%), and Basque (47.6%, a difference of 0.070%).
| Demographics | Rating | Rank | Disability Age Over 75 |
| Sudanese | 32.0 /100 | #186 | Fair 47.5% |
| Immigrants | Sudan | 31.8 /100 | #187 | Fair 47.5% |
| Basques | 30.9 /100 | #188 | Fair 47.6% |
| Immigrants | Kenya | 30.8 /100 | #189 | Fair 47.6% |
| Somalis | 29.5 /100 | #190 | Fair 47.6% |
| Portuguese | 29.3 /100 | #191 | Fair 47.6% |
| Immigrants | Jamaica | 28.3 /100 | #192 | Fair 47.6% |
| Ottawa | 28.1 /100 | #193 | Fair 47.6% |
| Immigrants | Lebanon | 26.5 /100 | #194 | Fair 47.6% |
| Immigrants | Trinidad and Tobago | 25.3 /100 | #195 | Fair 47.6% |
| Immigrants | Portugal | 23.8 /100 | #196 | Fair 47.6% |
| Pakistanis | 23.4 /100 | #197 | Fair 47.7% |
| Immigrants | Ukraine | 23.2 /100 | #198 | Fair 47.7% |
| Immigrants | Eritrea | 22.4 /100 | #199 | Fair 47.7% |
| Immigrants | Somalia | 21.4 /100 | #200 | Fair 47.7% |