Spanish American vs Immigrants from Lithuania Disability Age Over 75
COMPARE
Spanish American
Immigrants from Lithuania
Disability Age Over 75
Disability Age Over 75 Comparison
Spanish Americans
Immigrants from Lithuania
50.0%
DISABILITY AGE OVER 75
0.0/ 100
METRIC RATING
295th/ 347
METRIC RANK
44.9%
DISABILITY AGE OVER 75
100.0/ 100
METRIC RATING
6th/ 347
METRIC RANK
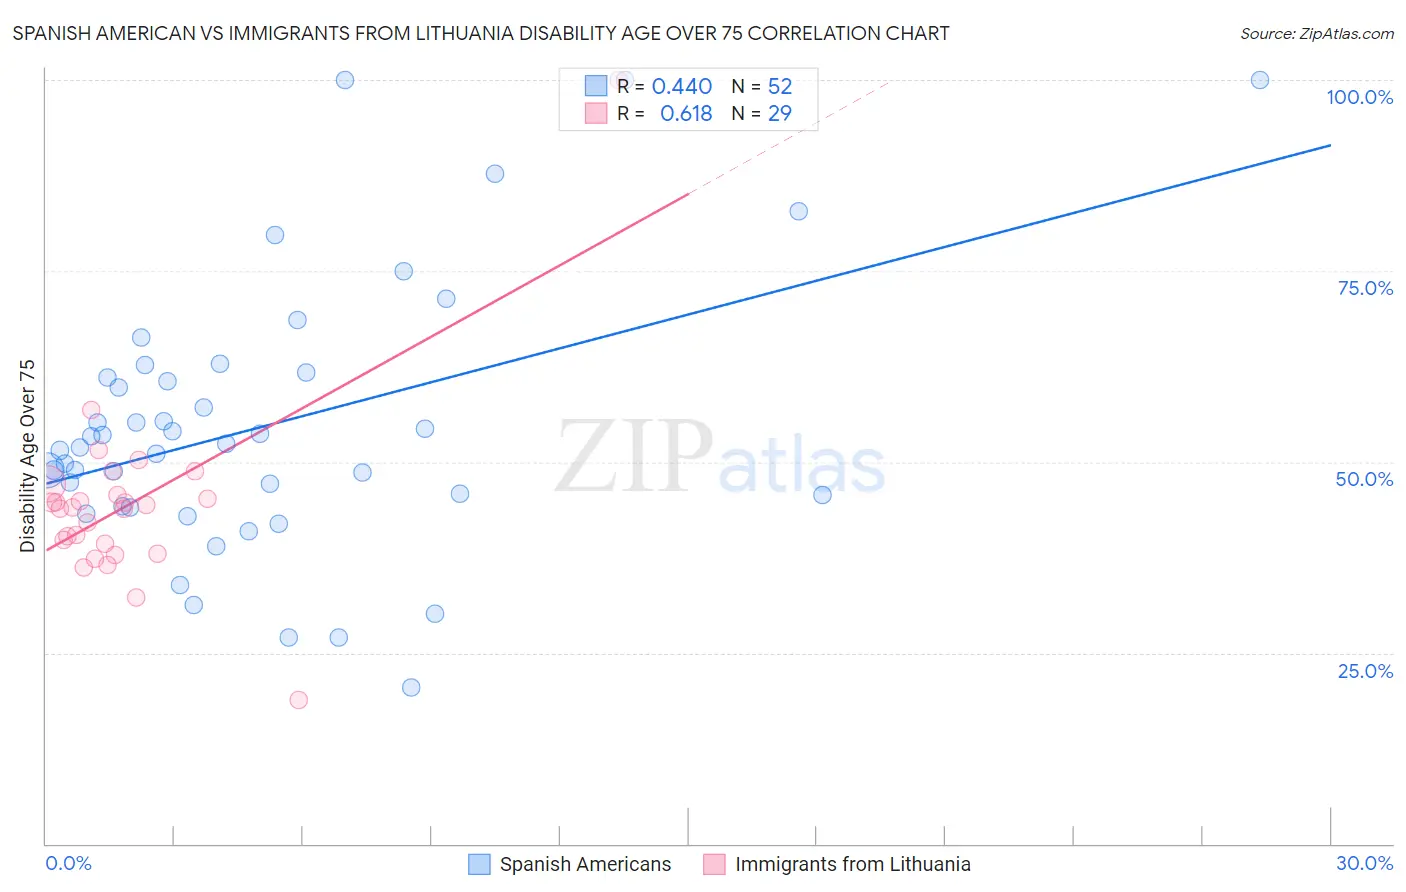
Spanish American vs Immigrants from Lithuania Disability Age Over 75 Correlation Chart
The statistical analysis conducted on geographies consisting of 103,158,462 people shows a moderate positive correlation between the proportion of Spanish Americans and percentage of population with a disability over the age of 75 in the United States with a correlation coefficient (R) of 0.440 and weighted average of 50.0%. Similarly, the statistical analysis conducted on geographies consisting of 117,703,908 people shows a significant positive correlation between the proportion of Immigrants from Lithuania and percentage of population with a disability over the age of 75 in the United States with a correlation coefficient (R) of 0.618 and weighted average of 44.9%, a difference of 11.5%.
Disability Age Over 75 Correlation Summary
| Measurement | Spanish American | Immigrants from Lithuania |
| Minimum | 20.5% | 18.8% |
| Maximum | 100.0% | 100.0% |
| Range | 79.5% | 81.2% |
| Mean | 54.7% | 44.4% |
| Median | 52.1% | 44.1% |
| Interquartile 25% (IQ1) | 44.9% | 38.6% |
| Interquartile 75% (IQ3) | 61.4% | 46.4% |
| Interquartile Range (IQR) | 16.4% | 7.8% |
| Standard Deviation (Sample) | 17.6% | 12.7% |
| Standard Deviation (Population) | 17.5% | 12.5% |
Similar Demographics by Disability Age Over 75
Demographics Similar to Spanish Americans by Disability Age Over 75
In terms of disability age over 75, the demographic groups most similar to Spanish Americans are Immigrants from Cambodia (50.0%, a difference of 0.040%), Mexican American Indian (50.0%, a difference of 0.040%), Armenian (50.0%, a difference of 0.060%), Marshallese (50.1%, a difference of 0.12%), and Spanish American Indian (49.9%, a difference of 0.16%).
| Demographics | Rating | Rank | Disability Age Over 75 |
| Yaqui | 0.0 /100 | #288 | Tragic 49.8% |
| Osage | 0.0 /100 | #289 | Tragic 49.8% |
| Puget Sound Salish | 0.0 /100 | #290 | Tragic 49.8% |
| Arapaho | 0.0 /100 | #291 | Tragic 49.8% |
| Shoshone | 0.0 /100 | #292 | Tragic 49.9% |
| Spanish American Indians | 0.0 /100 | #293 | Tragic 49.9% |
| Immigrants | Cambodia | 0.0 /100 | #294 | Tragic 50.0% |
| Spanish Americans | 0.0 /100 | #295 | Tragic 50.0% |
| Mexican American Indians | 0.0 /100 | #296 | Tragic 50.0% |
| Armenians | 0.0 /100 | #297 | Tragic 50.0% |
| Marshallese | 0.0 /100 | #298 | Tragic 50.1% |
| Immigrants | Micronesia | 0.0 /100 | #299 | Tragic 50.1% |
| Cape Verdeans | 0.0 /100 | #300 | Tragic 50.1% |
| Dominicans | 0.0 /100 | #301 | Tragic 50.2% |
| Cherokee | 0.0 /100 | #302 | Tragic 50.2% |
Demographics Similar to Immigrants from Lithuania by Disability Age Over 75
In terms of disability age over 75, the demographic groups most similar to Immigrants from Lithuania are Okinawan (44.9%, a difference of 0.040%), Luxembourger (44.8%, a difference of 0.090%), Carpatho Rusyn (44.8%, a difference of 0.15%), Immigrants from Austria (44.9%, a difference of 0.16%), and Eastern European (44.8%, a difference of 0.18%).
| Demographics | Rating | Rank | Disability Age Over 75 |
| Cypriots | 100.0 /100 | #1 | Exceptional 43.5% |
| Immigrants | Ireland | 100.0 /100 | #2 | Exceptional 44.7% |
| Eastern Europeans | 100.0 /100 | #3 | Exceptional 44.8% |
| Carpatho Rusyns | 100.0 /100 | #4 | Exceptional 44.8% |
| Luxembourgers | 100.0 /100 | #5 | Exceptional 44.8% |
| Immigrants | Lithuania | 100.0 /100 | #6 | Exceptional 44.9% |
| Okinawans | 100.0 /100 | #7 | Exceptional 44.9% |
| Immigrants | Austria | 100.0 /100 | #8 | Exceptional 44.9% |
| Paraguayans | 100.0 /100 | #9 | Exceptional 45.0% |
| Bulgarians | 100.0 /100 | #10 | Exceptional 45.1% |
| Lithuanians | 100.0 /100 | #11 | Exceptional 45.1% |
| Immigrants | Czechoslovakia | 100.0 /100 | #12 | Exceptional 45.1% |
| Latvians | 100.0 /100 | #13 | Exceptional 45.1% |
| Immigrants | Scotland | 100.0 /100 | #14 | Exceptional 45.1% |
| Immigrants | Sweden | 100.0 /100 | #15 | Exceptional 45.1% |