Immigrants from Hungary vs Immigrants from Zaire Male Disability
COMPARE
Immigrants from Hungary
Immigrants from Zaire
Male Disability
Male Disability Comparison
Immigrants from Hungary
Immigrants from Zaire
11.1%
MALE DISABILITY
61.2/ 100
METRIC RATING
166th/ 347
METRIC RANK
11.4%
MALE DISABILITY
27.6/ 100
METRIC RATING
186th/ 347
METRIC RANK
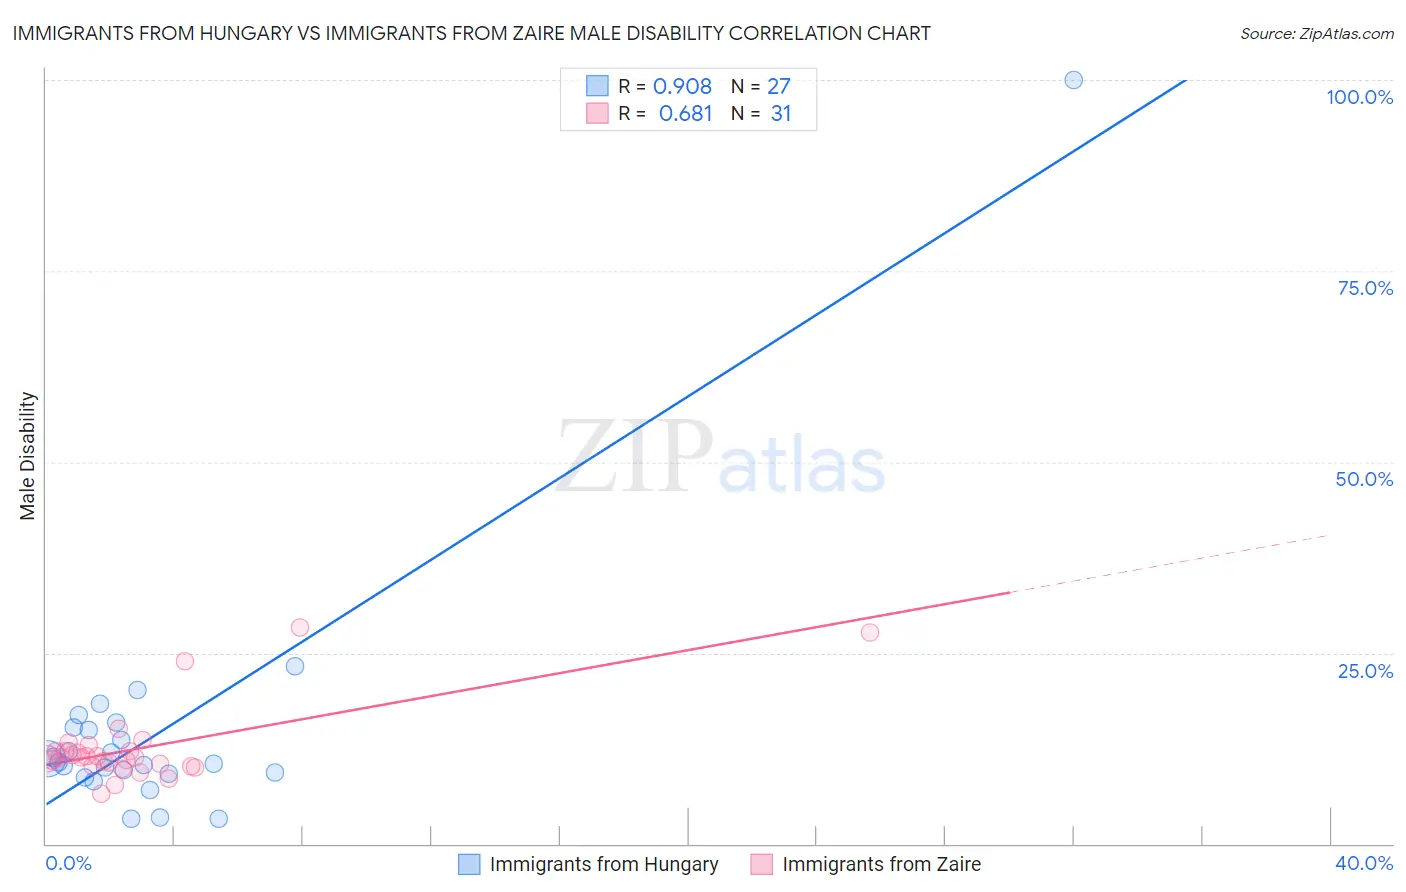
Immigrants from Hungary vs Immigrants from Zaire Male Disability Correlation Chart
The statistical analysis conducted on geographies consisting of 195,705,126 people shows a near-perfect positive correlation between the proportion of Immigrants from Hungary and percentage of males with a disability in the United States with a correlation coefficient (R) of 0.908 and weighted average of 11.1%. Similarly, the statistical analysis conducted on geographies consisting of 107,255,080 people shows a significant positive correlation between the proportion of Immigrants from Zaire and percentage of males with a disability in the United States with a correlation coefficient (R) of 0.681 and weighted average of 11.4%, a difference of 2.0%.
Male Disability Correlation Summary
| Measurement | Immigrants from Hungary | Immigrants from Zaire |
| Minimum | 3.2% | 6.5% |
| Maximum | 100.0% | 28.4% |
| Range | 96.8% | 21.9% |
| Mean | 14.7% | 12.5% |
| Median | 10.7% | 11.2% |
| Interquartile 25% (IQ1) | 9.1% | 10.2% |
| Interquartile 75% (IQ3) | 15.3% | 12.1% |
| Interquartile Range (IQR) | 6.1% | 1.9% |
| Standard Deviation (Sample) | 17.7% | 5.0% |
| Standard Deviation (Population) | 17.4% | 4.9% |
Demographics Similar to Immigrants from Hungary and Immigrants from Zaire by Male Disability
In terms of male disability, the demographic groups most similar to Immigrants from Hungary are Immigrants from Southern Europe (11.2%, a difference of 0.39%), Immigrants from Latin America (11.2%, a difference of 0.41%), Barbadian (11.2%, a difference of 0.45%), New Zealander (11.2%, a difference of 0.47%), and Haitian (11.2%, a difference of 0.49%). Similarly, the demographic groups most similar to Immigrants from Zaire are Pakistani (11.3%, a difference of 0.18%), Iraqi (11.3%, a difference of 0.19%), Immigrants from Central America (11.3%, a difference of 0.34%), Immigrants from Belize (11.3%, a difference of 0.39%), and Immigrants from Senegal (11.3%, a difference of 0.43%).
| Demographics | Rating | Rank | Male Disability |
| Immigrants | Hungary | 61.2 /100 | #166 | Good 11.1% |
| Immigrants | Southern Europe | 54.4 /100 | #167 | Average 11.2% |
| Immigrants | Latin America | 54.0 /100 | #168 | Average 11.2% |
| Barbadians | 53.4 /100 | #169 | Average 11.2% |
| New Zealanders | 52.9 /100 | #170 | Average 11.2% |
| Haitians | 52.5 /100 | #171 | Average 11.2% |
| Romanians | 50.7 /100 | #172 | Average 11.2% |
| Immigrants | Burma/Myanmar | 50.4 /100 | #173 | Average 11.2% |
| Maltese | 50.0 /100 | #174 | Average 11.2% |
| Immigrants | Honduras | 48.7 /100 | #175 | Average 11.2% |
| Syrians | 46.6 /100 | #176 | Average 11.2% |
| Immigrants | Norway | 44.2 /100 | #177 | Average 11.3% |
| Australians | 42.2 /100 | #178 | Average 11.3% |
| Immigrants | Caribbean | 41.4 /100 | #179 | Average 11.3% |
| Hondurans | 41.1 /100 | #180 | Average 11.3% |
| Immigrants | Senegal | 34.4 /100 | #181 | Fair 11.3% |
| Immigrants | Belize | 33.7 /100 | #182 | Fair 11.3% |
| Immigrants | Central America | 32.9 /100 | #183 | Fair 11.3% |
| Iraqis | 30.5 /100 | #184 | Fair 11.3% |
| Pakistanis | 30.3 /100 | #185 | Fair 11.3% |
| Immigrants | Zaire | 27.6 /100 | #186 | Fair 11.4% |