Cajun vs Immigrants from Zaire Male Disability
COMPARE
Cajun
Immigrants from Zaire
Male Disability
Male Disability Comparison
Cajuns
Immigrants from Zaire
14.4%
MALE DISABILITY
0.0/ 100
METRIC RATING
329th/ 347
METRIC RANK
11.4%
MALE DISABILITY
27.6/ 100
METRIC RATING
186th/ 347
METRIC RANK
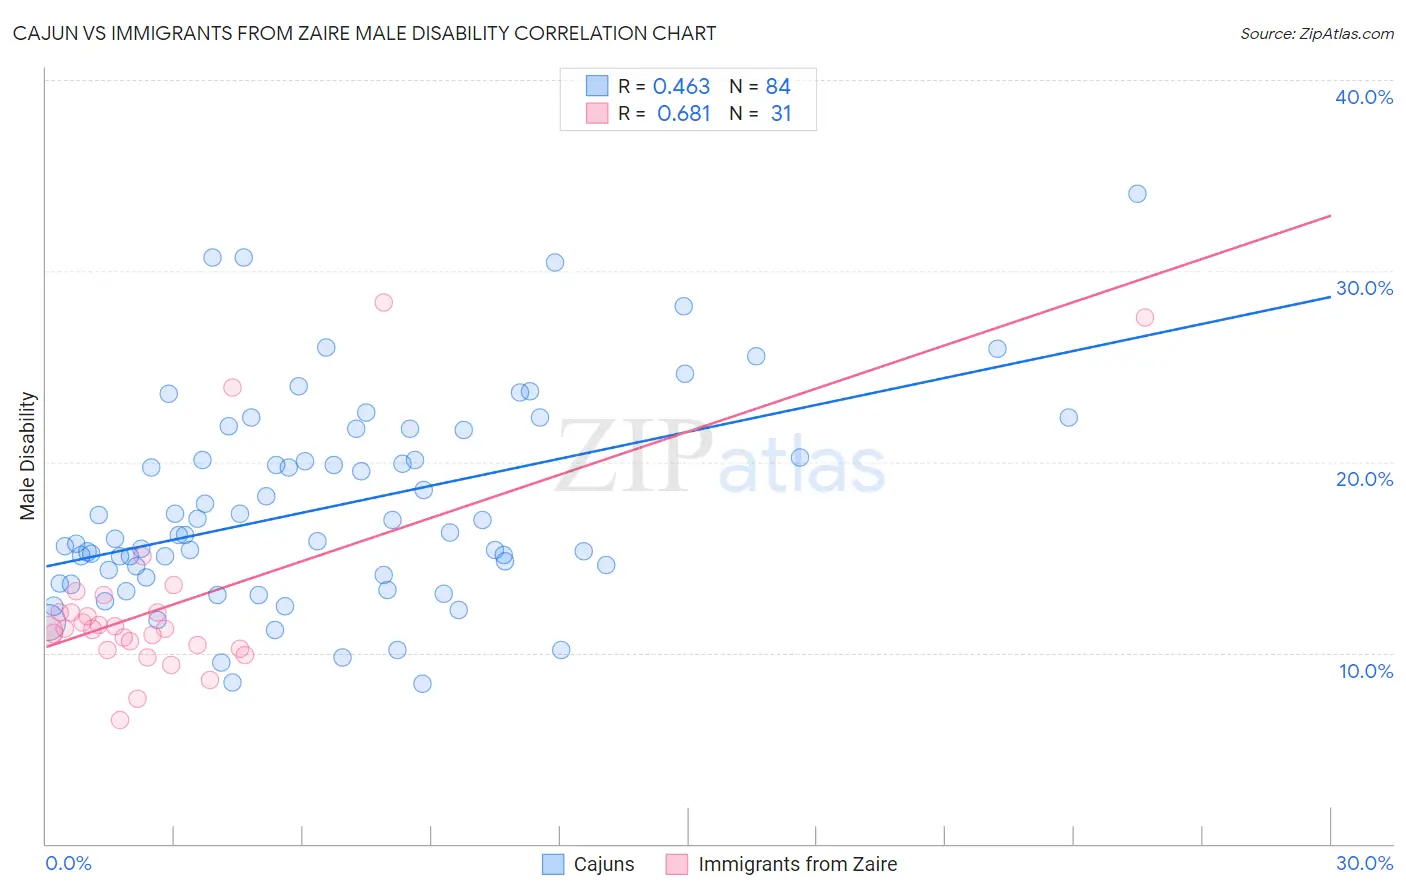
Cajun vs Immigrants from Zaire Male Disability Correlation Chart
The statistical analysis conducted on geographies consisting of 149,697,026 people shows a moderate positive correlation between the proportion of Cajuns and percentage of males with a disability in the United States with a correlation coefficient (R) of 0.463 and weighted average of 14.4%. Similarly, the statistical analysis conducted on geographies consisting of 107,255,080 people shows a significant positive correlation between the proportion of Immigrants from Zaire and percentage of males with a disability in the United States with a correlation coefficient (R) of 0.681 and weighted average of 11.4%, a difference of 26.4%.
Male Disability Correlation Summary
| Measurement | Cajun | Immigrants from Zaire |
| Minimum | 8.4% | 6.5% |
| Maximum | 34.1% | 28.4% |
| Range | 25.7% | 21.9% |
| Mean | 17.7% | 12.5% |
| Median | 16.2% | 11.2% |
| Interquartile 25% (IQ1) | 14.0% | 10.2% |
| Interquartile 75% (IQ3) | 21.0% | 12.1% |
| Interquartile Range (IQR) | 7.0% | 1.9% |
| Standard Deviation (Sample) | 5.4% | 5.0% |
| Standard Deviation (Population) | 5.4% | 4.9% |
Similar Demographics by Male Disability
Demographics Similar to Cajuns by Male Disability
In terms of male disability, the demographic groups most similar to Cajuns are Navajo (14.4%, a difference of 0.23%), Chippewa (14.3%, a difference of 0.57%), Potawatomi (14.2%, a difference of 1.0%), Native/Alaskan (14.2%, a difference of 1.1%), and Tohono O'odham (14.6%, a difference of 1.7%).
| Demographics | Rating | Rank | Male Disability |
| Apache | 0.0 /100 | #322 | Tragic 14.0% |
| Osage | 0.0 /100 | #323 | Tragic 14.0% |
| Comanche | 0.0 /100 | #324 | Tragic 14.1% |
| Ottawa | 0.0 /100 | #325 | Tragic 14.1% |
| Natives/Alaskans | 0.0 /100 | #326 | Tragic 14.2% |
| Potawatomi | 0.0 /100 | #327 | Tragic 14.2% |
| Chippewa | 0.0 /100 | #328 | Tragic 14.3% |
| Cajuns | 0.0 /100 | #329 | Tragic 14.4% |
| Navajo | 0.0 /100 | #330 | Tragic 14.4% |
| Tohono O'odham | 0.0 /100 | #331 | Tragic 14.6% |
| Seminole | 0.0 /100 | #332 | Tragic 14.7% |
| Yuman | 0.0 /100 | #333 | Tragic 14.7% |
| Cherokee | 0.0 /100 | #334 | Tragic 14.8% |
| Dutch West Indians | 0.0 /100 | #335 | Tragic 14.8% |
| Alaskan Athabascans | 0.0 /100 | #336 | Tragic 14.9% |
Demographics Similar to Immigrants from Zaire by Male Disability
In terms of male disability, the demographic groups most similar to Immigrants from Zaire are Immigrants from Austria (11.4%, a difference of 0.020%), Estonian (11.4%, a difference of 0.060%), Immigrants from Netherlands (11.4%, a difference of 0.12%), Immigrants from Bosnia and Herzegovina (11.4%, a difference of 0.16%), and Pakistani (11.3%, a difference of 0.18%).
| Demographics | Rating | Rank | Male Disability |
| Immigrants | Caribbean | 41.4 /100 | #179 | Average 11.3% |
| Hondurans | 41.1 /100 | #180 | Average 11.3% |
| Immigrants | Senegal | 34.4 /100 | #181 | Fair 11.3% |
| Immigrants | Belize | 33.7 /100 | #182 | Fair 11.3% |
| Immigrants | Central America | 32.9 /100 | #183 | Fair 11.3% |
| Iraqis | 30.5 /100 | #184 | Fair 11.3% |
| Pakistanis | 30.3 /100 | #185 | Fair 11.3% |
| Immigrants | Zaire | 27.6 /100 | #186 | Fair 11.4% |
| Immigrants | Austria | 27.3 /100 | #187 | Fair 11.4% |
| Estonians | 26.8 /100 | #188 | Fair 11.4% |
| Immigrants | Netherlands | 25.9 /100 | #189 | Fair 11.4% |
| Immigrants | Bosnia and Herzegovina | 25.4 /100 | #190 | Fair 11.4% |
| Senegalese | 23.2 /100 | #191 | Fair 11.4% |
| Assyrians/Chaldeans/Syriacs | 23.2 /100 | #192 | Fair 11.4% |
| Greeks | 22.2 /100 | #193 | Fair 11.4% |