French American Indian vs Immigrants from Zaire Male Disability
COMPARE
French American Indian
Immigrants from Zaire
Male Disability
Male Disability Comparison
French American Indians
Immigrants from Zaire
13.4%
MALE DISABILITY
0.0/ 100
METRIC RATING
308th/ 347
METRIC RANK
11.4%
MALE DISABILITY
27.6/ 100
METRIC RATING
186th/ 347
METRIC RANK
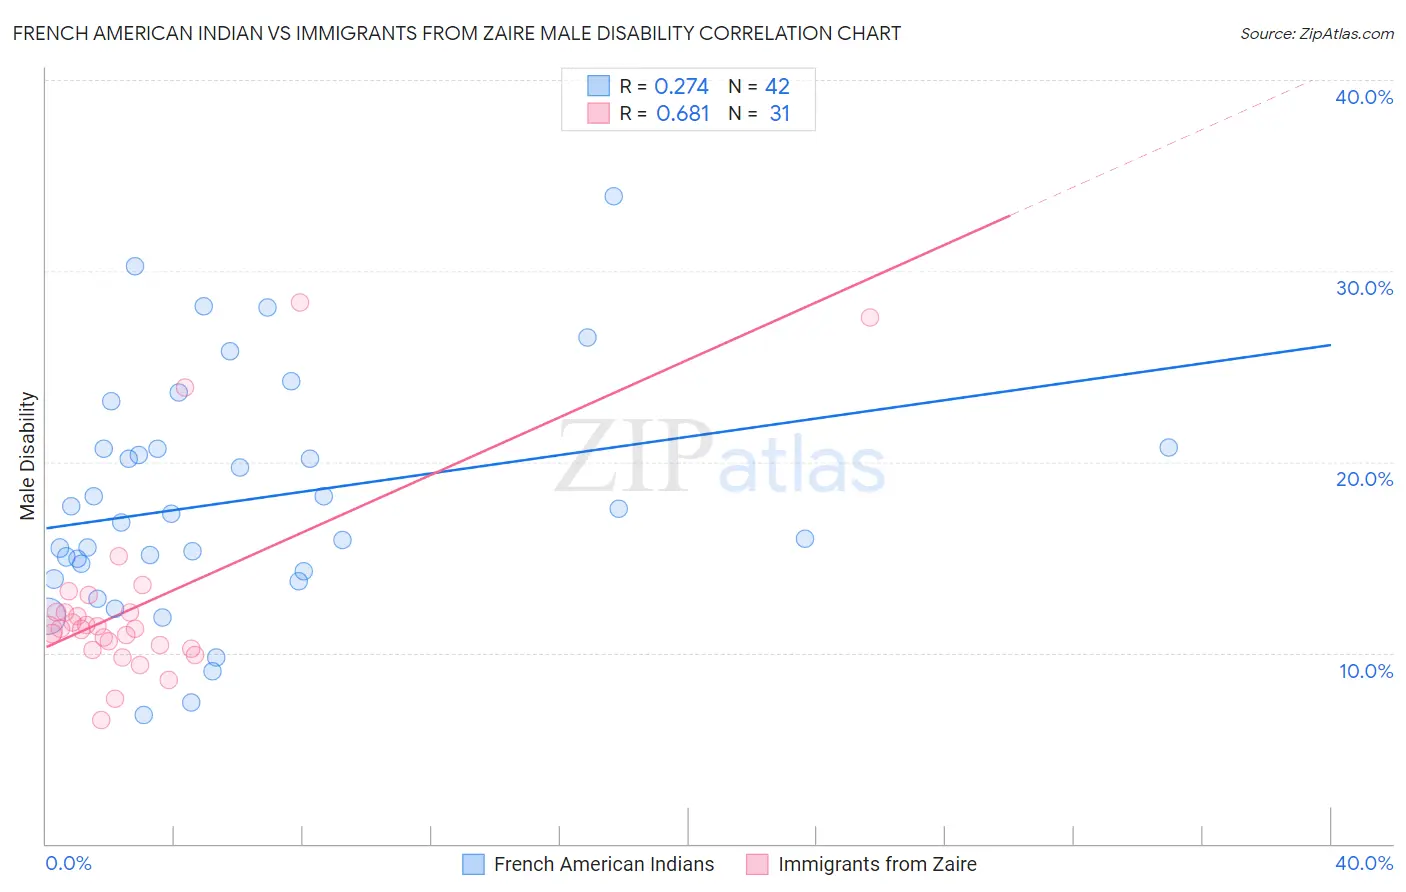
French American Indian vs Immigrants from Zaire Male Disability Correlation Chart
The statistical analysis conducted on geographies consisting of 131,973,508 people shows a weak positive correlation between the proportion of French American Indians and percentage of males with a disability in the United States with a correlation coefficient (R) of 0.274 and weighted average of 13.4%. Similarly, the statistical analysis conducted on geographies consisting of 107,255,080 people shows a significant positive correlation between the proportion of Immigrants from Zaire and percentage of males with a disability in the United States with a correlation coefficient (R) of 0.681 and weighted average of 11.4%, a difference of 17.6%.
Male Disability Correlation Summary
| Measurement | French American Indian | Immigrants from Zaire |
| Minimum | 6.8% | 6.5% |
| Maximum | 33.9% | 28.4% |
| Range | 27.2% | 21.9% |
| Mean | 17.9% | 12.5% |
| Median | 17.0% | 11.2% |
| Interquartile 25% (IQ1) | 14.3% | 10.2% |
| Interquartile 75% (IQ3) | 20.7% | 12.1% |
| Interquartile Range (IQR) | 6.4% | 1.9% |
| Standard Deviation (Sample) | 6.1% | 5.0% |
| Standard Deviation (Population) | 6.0% | 4.9% |
Similar Demographics by Male Disability
Demographics Similar to French American Indians by Male Disability
In terms of male disability, the demographic groups most similar to French American Indians are Arapaho (13.3%, a difference of 0.15%), Spanish American (13.3%, a difference of 0.38%), Blackfeet (13.4%, a difference of 0.42%), Immigrants from the Azores (13.4%, a difference of 0.56%), and French Canadian (13.3%, a difference of 0.58%).
| Demographics | Rating | Rank | Male Disability |
| French | 0.0 /100 | #301 | Tragic 13.0% |
| Crow | 0.0 /100 | #302 | Tragic 13.1% |
| Scotch-Irish | 0.0 /100 | #303 | Tragic 13.2% |
| Blacks/African Americans | 0.0 /100 | #304 | Tragic 13.2% |
| French Canadians | 0.0 /100 | #305 | Tragic 13.3% |
| Spanish Americans | 0.0 /100 | #306 | Tragic 13.3% |
| Arapaho | 0.0 /100 | #307 | Tragic 13.3% |
| French American Indians | 0.0 /100 | #308 | Tragic 13.4% |
| Blackfeet | 0.0 /100 | #309 | Tragic 13.4% |
| Immigrants | Azores | 0.0 /100 | #310 | Tragic 13.4% |
| Delaware | 0.0 /100 | #311 | Tragic 13.5% |
| Yakama | 0.0 /100 | #312 | Tragic 13.5% |
| Puget Sound Salish | 0.0 /100 | #313 | Tragic 13.5% |
| Aleuts | 0.0 /100 | #314 | Tragic 13.5% |
| Iroquois | 0.0 /100 | #315 | Tragic 13.6% |
Demographics Similar to Immigrants from Zaire by Male Disability
In terms of male disability, the demographic groups most similar to Immigrants from Zaire are Immigrants from Austria (11.4%, a difference of 0.020%), Estonian (11.4%, a difference of 0.060%), Immigrants from Netherlands (11.4%, a difference of 0.12%), Immigrants from Bosnia and Herzegovina (11.4%, a difference of 0.16%), and Pakistani (11.3%, a difference of 0.18%).
| Demographics | Rating | Rank | Male Disability |
| Immigrants | Caribbean | 41.4 /100 | #179 | Average 11.3% |
| Hondurans | 41.1 /100 | #180 | Average 11.3% |
| Immigrants | Senegal | 34.4 /100 | #181 | Fair 11.3% |
| Immigrants | Belize | 33.7 /100 | #182 | Fair 11.3% |
| Immigrants | Central America | 32.9 /100 | #183 | Fair 11.3% |
| Iraqis | 30.5 /100 | #184 | Fair 11.3% |
| Pakistanis | 30.3 /100 | #185 | Fair 11.3% |
| Immigrants | Zaire | 27.6 /100 | #186 | Fair 11.4% |
| Immigrants | Austria | 27.3 /100 | #187 | Fair 11.4% |
| Estonians | 26.8 /100 | #188 | Fair 11.4% |
| Immigrants | Netherlands | 25.9 /100 | #189 | Fair 11.4% |
| Immigrants | Bosnia and Herzegovina | 25.4 /100 | #190 | Fair 11.4% |
| Senegalese | 23.2 /100 | #191 | Fair 11.4% |
| Assyrians/Chaldeans/Syriacs | 23.2 /100 | #192 | Fair 11.4% |
| Greeks | 22.2 /100 | #193 | Fair 11.4% |