Moroccan vs Lumbee Unemployment
COMPARE
Moroccan
Lumbee
Unemployment
Unemployment Comparison
Moroccans
Lumbee
5.5%
UNEMPLOYMENT
3.2/ 100
METRIC RATING
237th/ 347
METRIC RANK
6.4%
UNEMPLOYMENT
0.0/ 100
METRIC RATING
306th/ 347
METRIC RANK
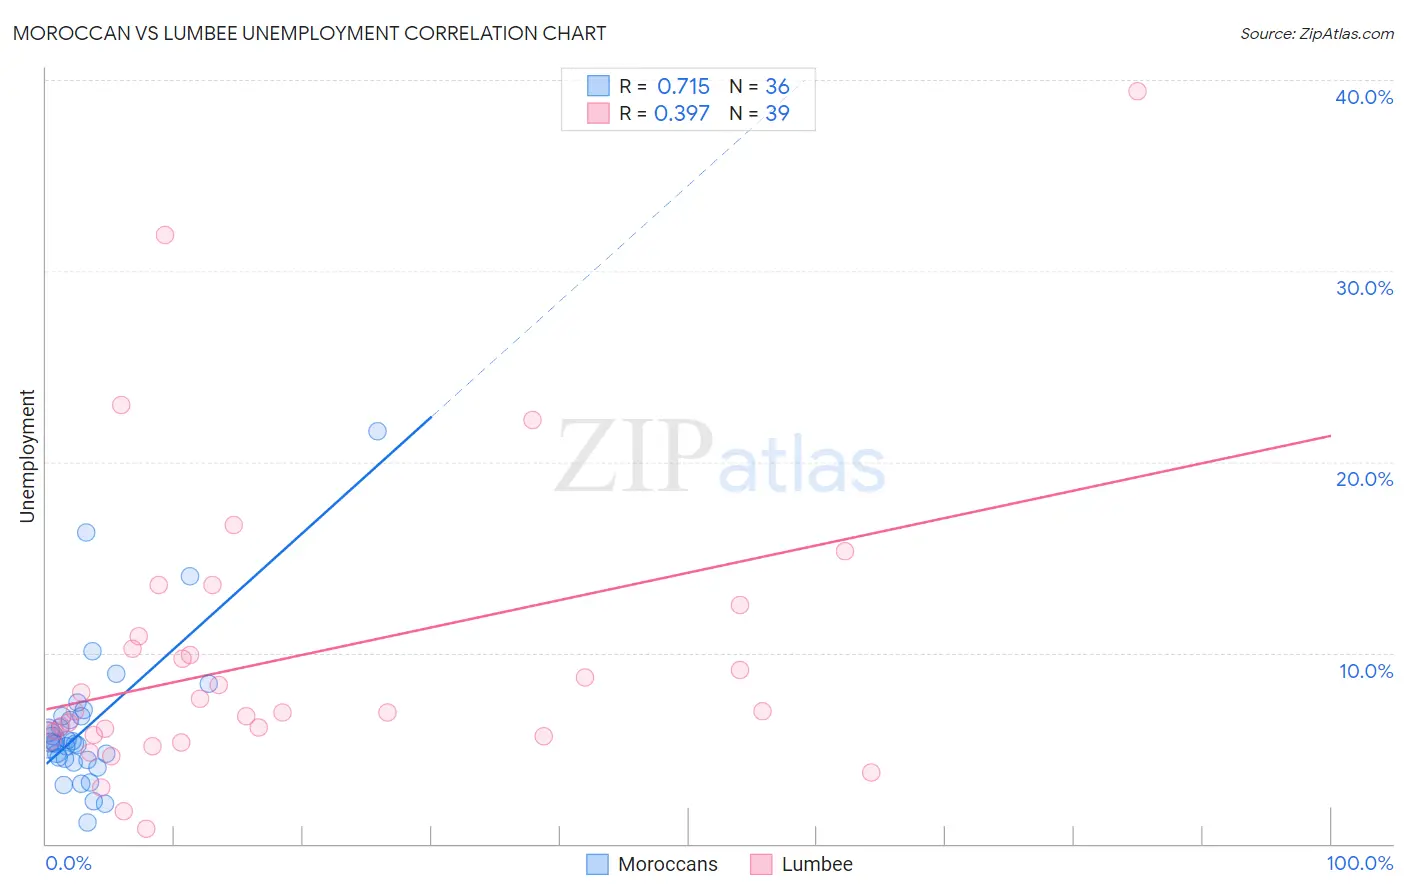
Moroccan vs Lumbee Unemployment Correlation Chart
The statistical analysis conducted on geographies consisting of 201,766,508 people shows a strong positive correlation between the proportion of Moroccans and unemployment in the United States with a correlation coefficient (R) of 0.715 and weighted average of 5.5%. Similarly, the statistical analysis conducted on geographies consisting of 92,248,032 people shows a mild positive correlation between the proportion of Lumbee and unemployment in the United States with a correlation coefficient (R) of 0.397 and weighted average of 6.4%, a difference of 16.4%.
Unemployment Correlation Summary
| Measurement | Moroccan | Lumbee |
| Minimum | 1.1% | 0.80% |
| Maximum | 21.6% | 39.4% |
| Range | 20.5% | 38.6% |
| Mean | 6.2% | 9.8% |
| Median | 5.3% | 6.9% |
| Interquartile 25% (IQ1) | 4.4% | 5.6% |
| Interquartile 75% (IQ3) | 6.7% | 10.9% |
| Interquartile Range (IQR) | 2.3% | 5.2% |
| Standard Deviation (Sample) | 4.0% | 7.8% |
| Standard Deviation (Population) | 3.9% | 7.7% |
Similar Demographics by Unemployment
Demographics Similar to Moroccans by Unemployment
In terms of unemployment, the demographic groups most similar to Moroccans are Immigrants from Cambodia (5.5%, a difference of 0.060%), Immigrants from Panama (5.5%, a difference of 0.090%), Immigrants from Western Asia (5.5%, a difference of 0.21%), Immigrants (5.5%, a difference of 0.29%), and Cree (5.6%, a difference of 0.31%).
| Demographics | Rating | Rank | Unemployment |
| Ottawa | 5.4 /100 | #230 | Tragic 5.5% |
| Immigrants | Africa | 4.9 /100 | #231 | Tragic 5.5% |
| Comanche | 4.9 /100 | #232 | Tragic 5.5% |
| Immigrants | Syria | 4.8 /100 | #233 | Tragic 5.5% |
| Panamanians | 4.7 /100 | #234 | Tragic 5.5% |
| Immigrants | Panama | 3.4 /100 | #235 | Tragic 5.5% |
| Immigrants | Cambodia | 3.3 /100 | #236 | Tragic 5.5% |
| Moroccans | 3.2 /100 | #237 | Tragic 5.5% |
| Immigrants | Western Asia | 2.8 /100 | #238 | Tragic 5.5% |
| Immigrants | Immigrants | 2.6 /100 | #239 | Tragic 5.5% |
| Cree | 2.6 /100 | #240 | Tragic 5.6% |
| Tlingit-Haida | 2.0 /100 | #241 | Tragic 5.6% |
| Spanish Americans | 2.0 /100 | #242 | Tragic 5.6% |
| Marshallese | 1.3 /100 | #243 | Tragic 5.6% |
| Dutch West Indians | 1.2 /100 | #244 | Tragic 5.6% |
Demographics Similar to Lumbee by Unemployment
In terms of unemployment, the demographic groups most similar to Lumbee are Menominee (6.4%, a difference of 0.030%), Immigrants from Jamaica (6.4%, a difference of 0.29%), Immigrants from Bangladesh (6.5%, a difference of 0.48%), Barbadian (6.5%, a difference of 0.86%), and Vietnamese (6.5%, a difference of 0.87%).
| Demographics | Rating | Rank | Unemployment |
| Immigrants | West Indies | 0.0 /100 | #299 | Tragic 6.3% |
| Immigrants | Trinidad and Tobago | 0.0 /100 | #300 | Tragic 6.3% |
| Trinidadians and Tobagonians | 0.0 /100 | #301 | Tragic 6.3% |
| West Indians | 0.0 /100 | #302 | Tragic 6.4% |
| Belizeans | 0.0 /100 | #303 | Tragic 6.4% |
| Immigrants | Jamaica | 0.0 /100 | #304 | Tragic 6.4% |
| Menominee | 0.0 /100 | #305 | Tragic 6.4% |
| Lumbee | 0.0 /100 | #306 | Tragic 6.4% |
| Immigrants | Bangladesh | 0.0 /100 | #307 | Tragic 6.5% |
| Barbadians | 0.0 /100 | #308 | Tragic 6.5% |
| Vietnamese | 0.0 /100 | #309 | Tragic 6.5% |
| Immigrants | Belize | 0.0 /100 | #310 | Tragic 6.5% |
| Cape Verdeans | 0.0 /100 | #311 | Tragic 6.5% |
| Colville | 0.0 /100 | #312 | Tragic 6.6% |
| Immigrants | Barbados | 0.0 /100 | #313 | Tragic 6.6% |