Moroccan vs Lumbee Nursery School
COMPARE
Moroccan
Lumbee
Nursery School
Nursery School Comparison
Moroccans
Lumbee
97.8%
NURSERY SCHOOL
8.3/ 100
METRIC RATING
213th/ 347
METRIC RANK
98.5%
NURSERY SCHOOL
99.9/ 100
METRIC RATING
37th/ 347
METRIC RANK
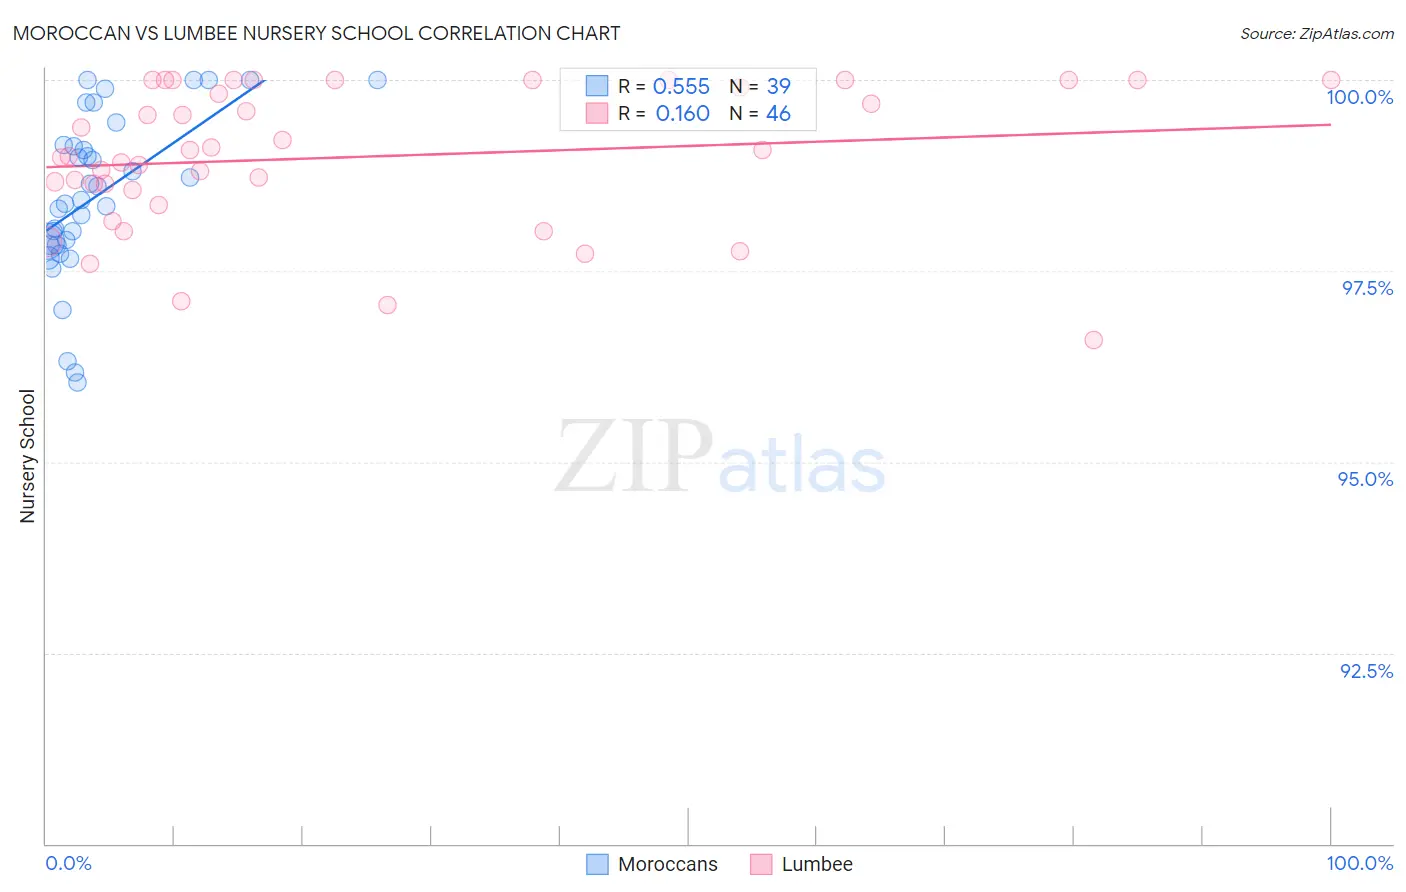
Moroccan vs Lumbee Nursery School Correlation Chart
The statistical analysis conducted on geographies consisting of 201,817,667 people shows a substantial positive correlation between the proportion of Moroccans and percentage of population with at least nursery school education in the United States with a correlation coefficient (R) of 0.555 and weighted average of 97.8%. Similarly, the statistical analysis conducted on geographies consisting of 92,298,794 people shows a poor positive correlation between the proportion of Lumbee and percentage of population with at least nursery school education in the United States with a correlation coefficient (R) of 0.160 and weighted average of 98.5%, a difference of 0.74%.
Nursery School Correlation Summary
| Measurement | Moroccan | Lumbee |
| Minimum | 96.0% | 96.6% |
| Maximum | 100.0% | 100.0% |
| Range | 4.0% | 3.4% |
| Mean | 98.5% | 99.0% |
| Median | 98.4% | 99.0% |
| Interquartile 25% (IQ1) | 97.8% | 98.6% |
| Interquartile 75% (IQ3) | 99.1% | 100.0% |
| Interquartile Range (IQR) | 1.3% | 1.4% |
| Standard Deviation (Sample) | 1.1% | 0.93% |
| Standard Deviation (Population) | 1.0% | 0.92% |
Similar Demographics by Nursery School
Demographics Similar to Moroccans by Nursery School
In terms of nursery school, the demographic groups most similar to Moroccans are Immigrants from Bahamas (97.8%, a difference of 0.0%), South American Indian (97.8%, a difference of 0.0%), Laotian (97.8%, a difference of 0.010%), Bahamian (97.8%, a difference of 0.010%), and Uruguayan (97.8%, a difference of 0.010%).
| Demographics | Rating | Rank | Nursery School |
| Immigrants | Albania | 16.4 /100 | #206 | Poor 97.9% |
| Africans | 15.4 /100 | #207 | Poor 97.9% |
| Immigrants | Northern Africa | 11.7 /100 | #208 | Poor 97.8% |
| Costa Ricans | 11.3 /100 | #209 | Poor 97.8% |
| Immigrants | Oceania | 10.2 /100 | #210 | Poor 97.8% |
| Laotians | 9.8 /100 | #211 | Tragic 97.8% |
| Immigrants | Bahamas | 8.6 /100 | #212 | Tragic 97.8% |
| Moroccans | 8.3 /100 | #213 | Tragic 97.8% |
| South American Indians | 8.0 /100 | #214 | Tragic 97.8% |
| Bahamians | 7.4 /100 | #215 | Tragic 97.8% |
| Uruguayans | 7.1 /100 | #216 | Tragic 97.8% |
| Samoans | 6.3 /100 | #217 | Tragic 97.8% |
| Immigrants | Panama | 5.3 /100 | #218 | Tragic 97.8% |
| Immigrants | Morocco | 5.1 /100 | #219 | Tragic 97.8% |
| Immigrants | Zaire | 4.4 /100 | #220 | Tragic 97.8% |
Demographics Similar to Lumbee by Nursery School
In terms of nursery school, the demographic groups most similar to Lumbee are Italian (98.5%, a difference of 0.0%), Latvian (98.5%, a difference of 0.010%), Chippewa (98.5%, a difference of 0.010%), British (98.5%, a difference of 0.020%), and Luxembourger (98.5%, a difference of 0.020%).
| Demographics | Rating | Rank | Nursery School |
| Europeans | 100.0 /100 | #30 | Exceptional 98.6% |
| Czechs | 100.0 /100 | #31 | Exceptional 98.6% |
| French Canadians | 100.0 /100 | #32 | Exceptional 98.6% |
| Scandinavians | 100.0 /100 | #33 | Exceptional 98.6% |
| Chinese | 100.0 /100 | #34 | Exceptional 98.6% |
| Swiss | 100.0 /100 | #35 | Exceptional 98.6% |
| British | 100.0 /100 | #36 | Exceptional 98.5% |
| Lumbee | 99.9 /100 | #37 | Exceptional 98.5% |
| Italians | 99.9 /100 | #38 | Exceptional 98.5% |
| Latvians | 99.9 /100 | #39 | Exceptional 98.5% |
| Chippewa | 99.9 /100 | #40 | Exceptional 98.5% |
| Luxembourgers | 99.9 /100 | #41 | Exceptional 98.5% |
| Eastern Europeans | 99.9 /100 | #42 | Exceptional 98.5% |
| Native Hawaiians | 99.9 /100 | #43 | Exceptional 98.5% |
| Belgians | 99.9 /100 | #44 | Exceptional 98.5% |