Immigrants from Dominica vs Lumbee Female Disability
COMPARE
Immigrants from Dominica
Lumbee
Female Disability
Female Disability Comparison
Immigrants from Dominica
Lumbee
13.0%
FEMALE DISABILITY
0.1/ 100
METRIC RATING
276th/ 347
METRIC RANK
15.8%
FEMALE DISABILITY
0.0/ 100
METRIC RATING
343rd/ 347
METRIC RANK
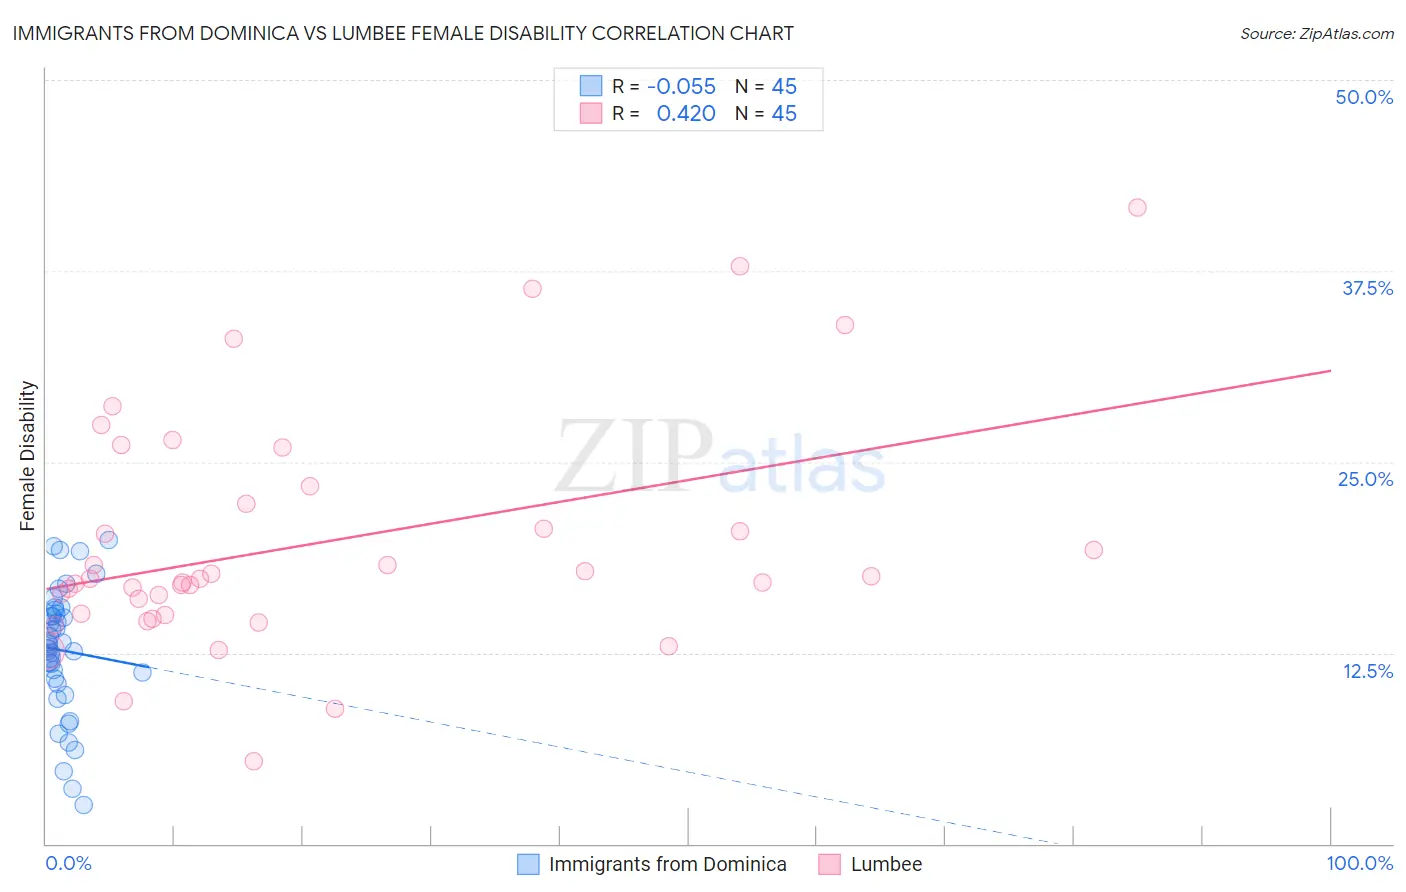
Immigrants from Dominica vs Lumbee Female Disability Correlation Chart
The statistical analysis conducted on geographies consisting of 83,793,109 people shows a slight negative correlation between the proportion of Immigrants from Dominica and percentage of females with a disability in the United States with a correlation coefficient (R) of -0.055 and weighted average of 13.0%. Similarly, the statistical analysis conducted on geographies consisting of 92,288,474 people shows a moderate positive correlation between the proportion of Lumbee and percentage of females with a disability in the United States with a correlation coefficient (R) of 0.420 and weighted average of 15.8%, a difference of 21.5%.
Female Disability Correlation Summary
| Measurement | Immigrants from Dominica | Lumbee |
| Minimum | 2.5% | 5.4% |
| Maximum | 19.9% | 41.7% |
| Range | 17.3% | 36.3% |
| Mean | 12.7% | 19.7% |
| Median | 13.0% | 17.4% |
| Interquartile 25% (IQ1) | 10.6% | 15.0% |
| Interquartile 75% (IQ3) | 15.2% | 22.8% |
| Interquartile Range (IQR) | 4.5% | 7.8% |
| Standard Deviation (Sample) | 4.1% | 7.7% |
| Standard Deviation (Population) | 4.1% | 7.6% |
Similar Demographics by Female Disability
Demographics Similar to Immigrants from Dominica by Female Disability
In terms of female disability, the demographic groups most similar to Immigrants from Dominica are Cheyenne (13.0%, a difference of 0.050%), Portuguese (13.0%, a difference of 0.10%), Spanish (13.0%, a difference of 0.20%), Sioux (12.9%, a difference of 0.22%), and German (12.9%, a difference of 0.24%).
| Demographics | Rating | Rank | Female Disability |
| Indonesians | 0.4 /100 | #269 | Tragic 12.8% |
| Immigrants | Liberia | 0.3 /100 | #270 | Tragic 12.9% |
| Dutch | 0.2 /100 | #271 | Tragic 12.9% |
| Germans | 0.1 /100 | #272 | Tragic 12.9% |
| Sioux | 0.1 /100 | #273 | Tragic 12.9% |
| Portuguese | 0.1 /100 | #274 | Tragic 13.0% |
| Cheyenne | 0.1 /100 | #275 | Tragic 13.0% |
| Immigrants | Dominica | 0.1 /100 | #276 | Tragic 13.0% |
| Spanish | 0.1 /100 | #277 | Tragic 13.0% |
| Scottish | 0.1 /100 | #278 | Tragic 13.0% |
| Arapaho | 0.1 /100 | #279 | Tragic 13.0% |
| Irish | 0.1 /100 | #280 | Tragic 13.1% |
| U.S. Virgin Islanders | 0.1 /100 | #281 | Tragic 13.1% |
| Welsh | 0.0 /100 | #282 | Tragic 13.1% |
| English | 0.0 /100 | #283 | Tragic 13.1% |
Demographics Similar to Lumbee by Female Disability
In terms of female disability, the demographic groups most similar to Lumbee are Kiowa (15.8%, a difference of 0.16%), Creek (15.7%, a difference of 0.68%), Choctaw (15.4%, a difference of 2.3%), Chickasaw (15.2%, a difference of 3.7%), and Colville (15.1%, a difference of 4.7%).
| Demographics | Rating | Rank | Female Disability |
| Immigrants | Azores | 0.0 /100 | #333 | Tragic 14.9% |
| Cherokee | 0.0 /100 | #334 | Tragic 14.9% |
| Cajuns | 0.0 /100 | #335 | Tragic 14.9% |
| Seminole | 0.0 /100 | #336 | Tragic 15.0% |
| Tohono O'odham | 0.0 /100 | #337 | Tragic 15.0% |
| Dutch West Indians | 0.0 /100 | #338 | Tragic 15.0% |
| Colville | 0.0 /100 | #339 | Tragic 15.1% |
| Chickasaw | 0.0 /100 | #340 | Tragic 15.2% |
| Choctaw | 0.0 /100 | #341 | Tragic 15.4% |
| Creek | 0.0 /100 | #342 | Tragic 15.7% |
| Lumbee | 0.0 /100 | #343 | Tragic 15.8% |
| Kiowa | 0.0 /100 | #344 | Tragic 15.8% |
| Puerto Ricans | 0.0 /100 | #345 | Tragic 16.6% |
| Tsimshian | 0.0 /100 | #346 | Tragic 16.8% |
| Houma | 0.0 /100 | #347 | Tragic 16.9% |