Moroccan vs Immigrants from Malaysia Disability Age Under 5
COMPARE
Moroccan
Immigrants from Malaysia
Disability Age Under 5
Disability Age Under 5 Comparison
Moroccans
Immigrants from Malaysia
1.2%
DISABILITY AGE UNDER 5
83.6/ 100
METRIC RATING
136th/ 347
METRIC RANK
1.1%
DISABILITY AGE UNDER 5
99.4/ 100
METRIC RATING
59th/ 347
METRIC RANK
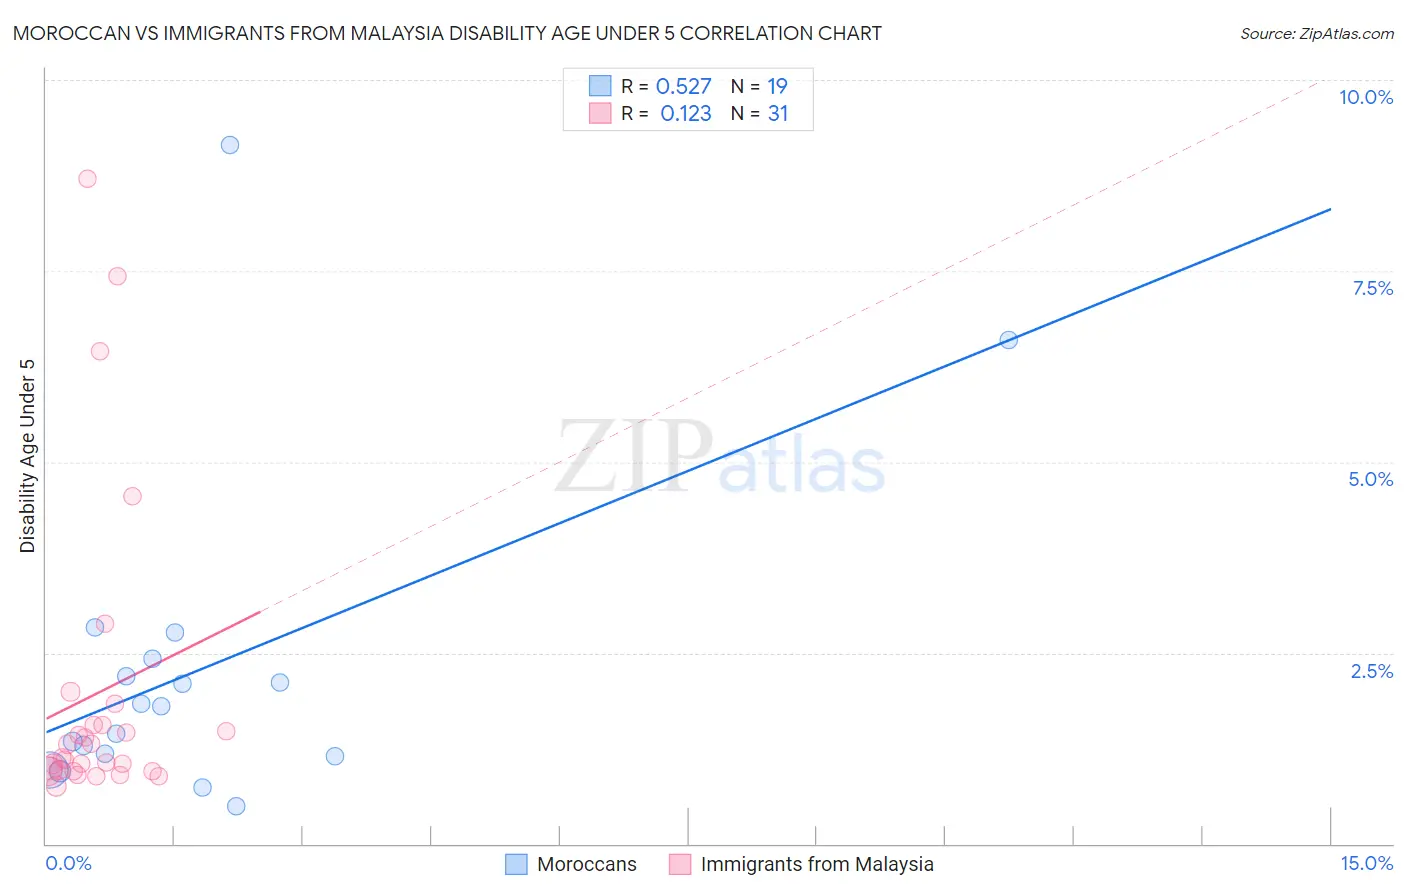
Moroccan vs Immigrants from Malaysia Disability Age Under 5 Correlation Chart
The statistical analysis conducted on geographies consisting of 132,015,425 people shows a substantial positive correlation between the proportion of Moroccans and percentage of population with a disability under the age of 5 in the United States with a correlation coefficient (R) of 0.527 and weighted average of 1.2%. Similarly, the statistical analysis conducted on geographies consisting of 132,664,021 people shows a poor positive correlation between the proportion of Immigrants from Malaysia and percentage of population with a disability under the age of 5 in the United States with a correlation coefficient (R) of 0.123 and weighted average of 1.1%, a difference of 8.8%.
Disability Age Under 5 Correlation Summary
| Measurement | Moroccan | Immigrants from Malaysia |
| Minimum | 0.49% | 0.76% |
| Maximum | 9.2% | 8.7% |
| Range | 8.7% | 7.9% |
| Mean | 2.3% | 2.0% |
| Median | 1.8% | 1.1% |
| Interquartile 25% (IQ1) | 1.2% | 0.95% |
| Interquartile 75% (IQ3) | 2.4% | 1.6% |
| Interquartile Range (IQR) | 1.3% | 0.61% |
| Standard Deviation (Sample) | 2.1% | 2.0% |
| Standard Deviation (Population) | 2.1% | 2.0% |
Similar Demographics by Disability Age Under 5
Demographics Similar to Moroccans by Disability Age Under 5
In terms of disability age under 5, the demographic groups most similar to Moroccans are Immigrants from Eastern Africa (1.2%, a difference of 0.090%), Immigrants from Czechoslovakia (1.2%, a difference of 0.14%), Fijian (1.2%, a difference of 0.18%), New Zealander (1.2%, a difference of 0.37%), and Argentinean (1.2%, a difference of 0.38%).
| Demographics | Rating | Rank | Disability Age Under 5 |
| Immigrants | Immigrants | 88.0 /100 | #129 | Excellent 1.2% |
| Koreans | 87.7 /100 | #130 | Excellent 1.2% |
| Immigrants | Serbia | 87.6 /100 | #131 | Excellent 1.2% |
| Immigrants | Eastern Europe | 87.3 /100 | #132 | Excellent 1.2% |
| Immigrants | Spain | 86.5 /100 | #133 | Excellent 1.2% |
| Argentineans | 85.7 /100 | #134 | Excellent 1.2% |
| Fijians | 84.7 /100 | #135 | Excellent 1.2% |
| Moroccans | 83.6 /100 | #136 | Excellent 1.2% |
| Immigrants | Eastern Africa | 83.1 /100 | #137 | Excellent 1.2% |
| Immigrants | Czechoslovakia | 82.8 /100 | #138 | Excellent 1.2% |
| New Zealanders | 81.4 /100 | #139 | Excellent 1.2% |
| Somalis | 80.8 /100 | #140 | Excellent 1.2% |
| Immigrants | Honduras | 80.4 /100 | #141 | Excellent 1.2% |
| Immigrants | Colombia | 79.3 /100 | #142 | Good 1.2% |
| Alsatians | 79.3 /100 | #143 | Good 1.2% |
Demographics Similar to Immigrants from Malaysia by Disability Age Under 5
In terms of disability age under 5, the demographic groups most similar to Immigrants from Malaysia are Immigrants from Egypt (1.1%, a difference of 0.12%), Assyrian/Chaldean/Syriac (1.1%, a difference of 0.30%), Ecuadorian (1.1%, a difference of 0.33%), Salvadoran (1.1%, a difference of 0.73%), and Immigrants from Western Asia (1.1%, a difference of 0.76%).
| Demographics | Rating | Rank | Disability Age Under 5 |
| Immigrants | Bolivia | 99.6 /100 | #52 | Exceptional 1.1% |
| Asians | 99.6 /100 | #53 | Exceptional 1.1% |
| Immigrants | El Salvador | 99.6 /100 | #54 | Exceptional 1.1% |
| Salvadorans | 99.5 /100 | #55 | Exceptional 1.1% |
| Ecuadorians | 99.5 /100 | #56 | Exceptional 1.1% |
| Assyrians/Chaldeans/Syriacs | 99.5 /100 | #57 | Exceptional 1.1% |
| Immigrants | Egypt | 99.4 /100 | #58 | Exceptional 1.1% |
| Immigrants | Malaysia | 99.4 /100 | #59 | Exceptional 1.1% |
| Immigrants | Western Asia | 99.2 /100 | #60 | Exceptional 1.1% |
| Immigrants | Ethiopia | 99.2 /100 | #61 | Exceptional 1.1% |
| Immigrants | Switzerland | 99.2 /100 | #62 | Exceptional 1.1% |
| Immigrants | Vietnam | 99.1 /100 | #63 | Exceptional 1.1% |
| Egyptians | 98.9 /100 | #64 | Exceptional 1.1% |
| Immigrants | Korea | 98.8 /100 | #65 | Exceptional 1.1% |
| Immigrants | Indonesia | 98.7 /100 | #66 | Exceptional 1.1% |