Immigrants from England vs Immigrants from Malaysia Disability Age Under 5
COMPARE
Immigrants from England
Immigrants from Malaysia
Disability Age Under 5
Disability Age Under 5 Comparison
Immigrants from England
Immigrants from Malaysia
1.4%
DISABILITY AGE UNDER 5
1.0/ 100
METRIC RATING
247th/ 347
METRIC RANK
1.1%
DISABILITY AGE UNDER 5
99.4/ 100
METRIC RATING
59th/ 347
METRIC RANK
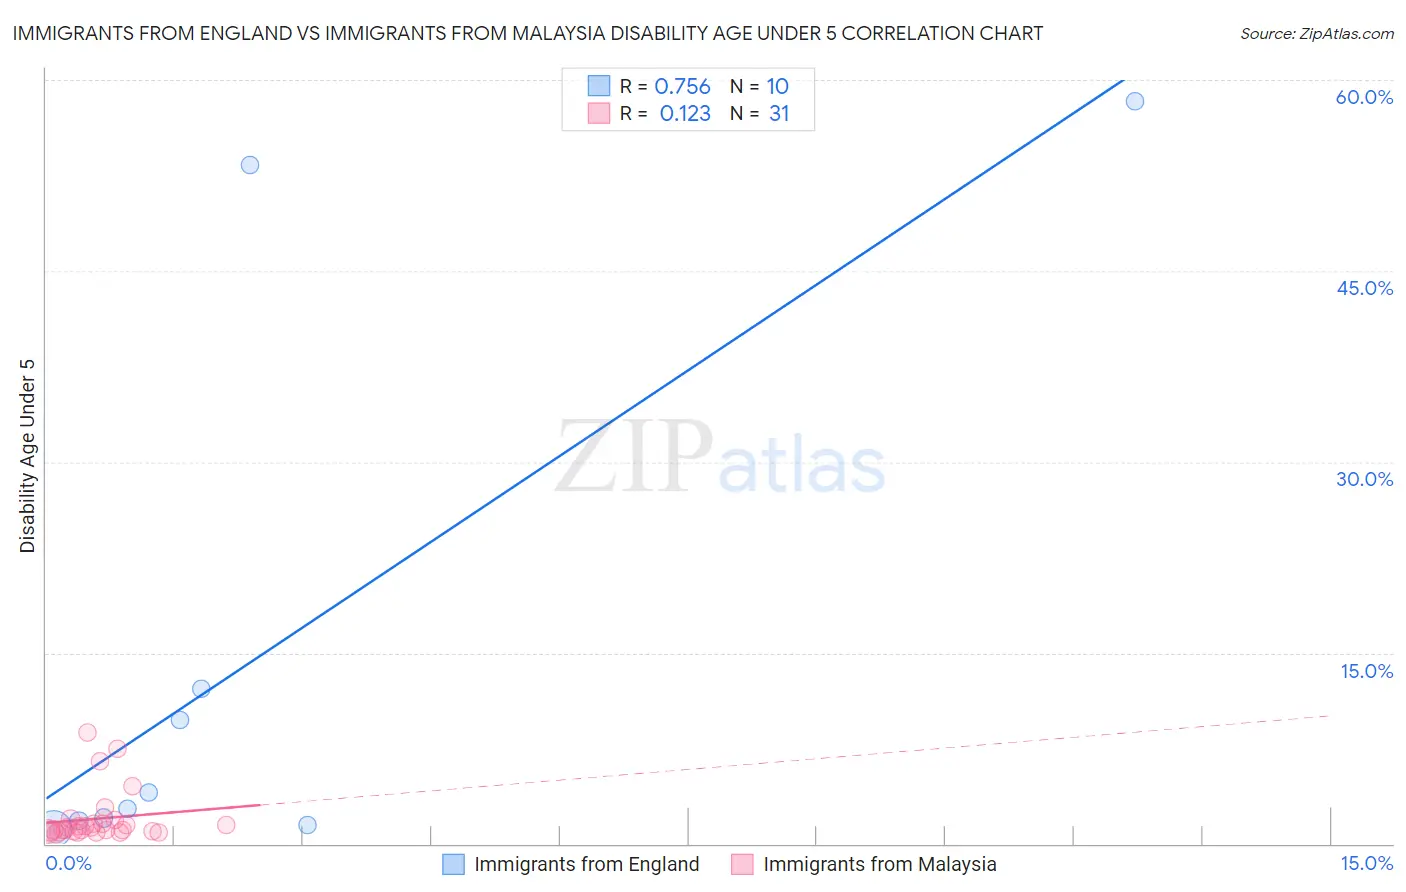
Immigrants from England vs Immigrants from Malaysia Disability Age Under 5 Correlation Chart
The statistical analysis conducted on geographies consisting of 209,371,779 people shows a strong positive correlation between the proportion of Immigrants from England and percentage of population with a disability under the age of 5 in the United States with a correlation coefficient (R) of 0.756 and weighted average of 1.4%. Similarly, the statistical analysis conducted on geographies consisting of 132,664,021 people shows a poor positive correlation between the proportion of Immigrants from Malaysia and percentage of population with a disability under the age of 5 in the United States with a correlation coefficient (R) of 0.123 and weighted average of 1.1%, a difference of 24.7%.
Disability Age Under 5 Correlation Summary
| Measurement | Immigrants from England | Immigrants from Malaysia |
| Minimum | 1.2% | 0.76% |
| Maximum | 58.3% | 8.7% |
| Range | 57.2% | 7.9% |
| Mean | 14.7% | 2.0% |
| Median | 3.4% | 1.1% |
| Interquartile 25% (IQ1) | 1.8% | 0.95% |
| Interquartile 75% (IQ3) | 12.1% | 1.6% |
| Interquartile Range (IQR) | 10.3% | 0.61% |
| Standard Deviation (Sample) | 22.0% | 2.0% |
| Standard Deviation (Population) | 20.9% | 2.0% |
Similar Demographics by Disability Age Under 5
Demographics Similar to Immigrants from England by Disability Age Under 5
In terms of disability age under 5, the demographic groups most similar to Immigrants from England are Russian (1.4%, a difference of 0.010%), Eastern European (1.4%, a difference of 0.030%), Bermudan (1.4%, a difference of 0.11%), African (1.4%, a difference of 0.12%), and Potawatomi (1.4%, a difference of 0.14%).
| Demographics | Rating | Rank | Disability Age Under 5 |
| Native Hawaiians | 2.2 /100 | #240 | Tragic 1.3% |
| Maltese | 2.2 /100 | #241 | Tragic 1.3% |
| Lumbee | 2.1 /100 | #242 | Tragic 1.3% |
| Immigrants | Cameroon | 1.7 /100 | #243 | Tragic 1.4% |
| Spaniards | 1.4 /100 | #244 | Tragic 1.4% |
| Potawatomi | 1.1 /100 | #245 | Tragic 1.4% |
| Russians | 1.0 /100 | #246 | Tragic 1.4% |
| Immigrants | England | 1.0 /100 | #247 | Tragic 1.4% |
| Eastern Europeans | 1.0 /100 | #248 | Tragic 1.4% |
| Bermudans | 1.0 /100 | #249 | Tragic 1.4% |
| Africans | 1.0 /100 | #250 | Tragic 1.4% |
| Immigrants | Hungary | 1.0 /100 | #251 | Tragic 1.4% |
| Immigrants | Scotland | 0.9 /100 | #252 | Tragic 1.4% |
| Australians | 0.7 /100 | #253 | Tragic 1.4% |
| Immigrants | Brazil | 0.7 /100 | #254 | Tragic 1.4% |
Demographics Similar to Immigrants from Malaysia by Disability Age Under 5
In terms of disability age under 5, the demographic groups most similar to Immigrants from Malaysia are Immigrants from Egypt (1.1%, a difference of 0.12%), Assyrian/Chaldean/Syriac (1.1%, a difference of 0.30%), Ecuadorian (1.1%, a difference of 0.33%), Salvadoran (1.1%, a difference of 0.73%), and Immigrants from Western Asia (1.1%, a difference of 0.76%).
| Demographics | Rating | Rank | Disability Age Under 5 |
| Immigrants | Bolivia | 99.6 /100 | #52 | Exceptional 1.1% |
| Asians | 99.6 /100 | #53 | Exceptional 1.1% |
| Immigrants | El Salvador | 99.6 /100 | #54 | Exceptional 1.1% |
| Salvadorans | 99.5 /100 | #55 | Exceptional 1.1% |
| Ecuadorians | 99.5 /100 | #56 | Exceptional 1.1% |
| Assyrians/Chaldeans/Syriacs | 99.5 /100 | #57 | Exceptional 1.1% |
| Immigrants | Egypt | 99.4 /100 | #58 | Exceptional 1.1% |
| Immigrants | Malaysia | 99.4 /100 | #59 | Exceptional 1.1% |
| Immigrants | Western Asia | 99.2 /100 | #60 | Exceptional 1.1% |
| Immigrants | Ethiopia | 99.2 /100 | #61 | Exceptional 1.1% |
| Immigrants | Switzerland | 99.2 /100 | #62 | Exceptional 1.1% |
| Immigrants | Vietnam | 99.1 /100 | #63 | Exceptional 1.1% |
| Egyptians | 98.9 /100 | #64 | Exceptional 1.1% |
| Immigrants | Korea | 98.8 /100 | #65 | Exceptional 1.1% |
| Immigrants | Indonesia | 98.7 /100 | #66 | Exceptional 1.1% |