Moroccan vs Immigrants from Malaysia Nursery School
COMPARE
Moroccan
Immigrants from Malaysia
Nursery School
Nursery School Comparison
Moroccans
Immigrants from Malaysia
97.8%
NURSERY SCHOOL
8.3/ 100
METRIC RATING
213th/ 347
METRIC RANK
97.7%
NURSERY SCHOOL
1.9/ 100
METRIC RATING
236th/ 347
METRIC RANK
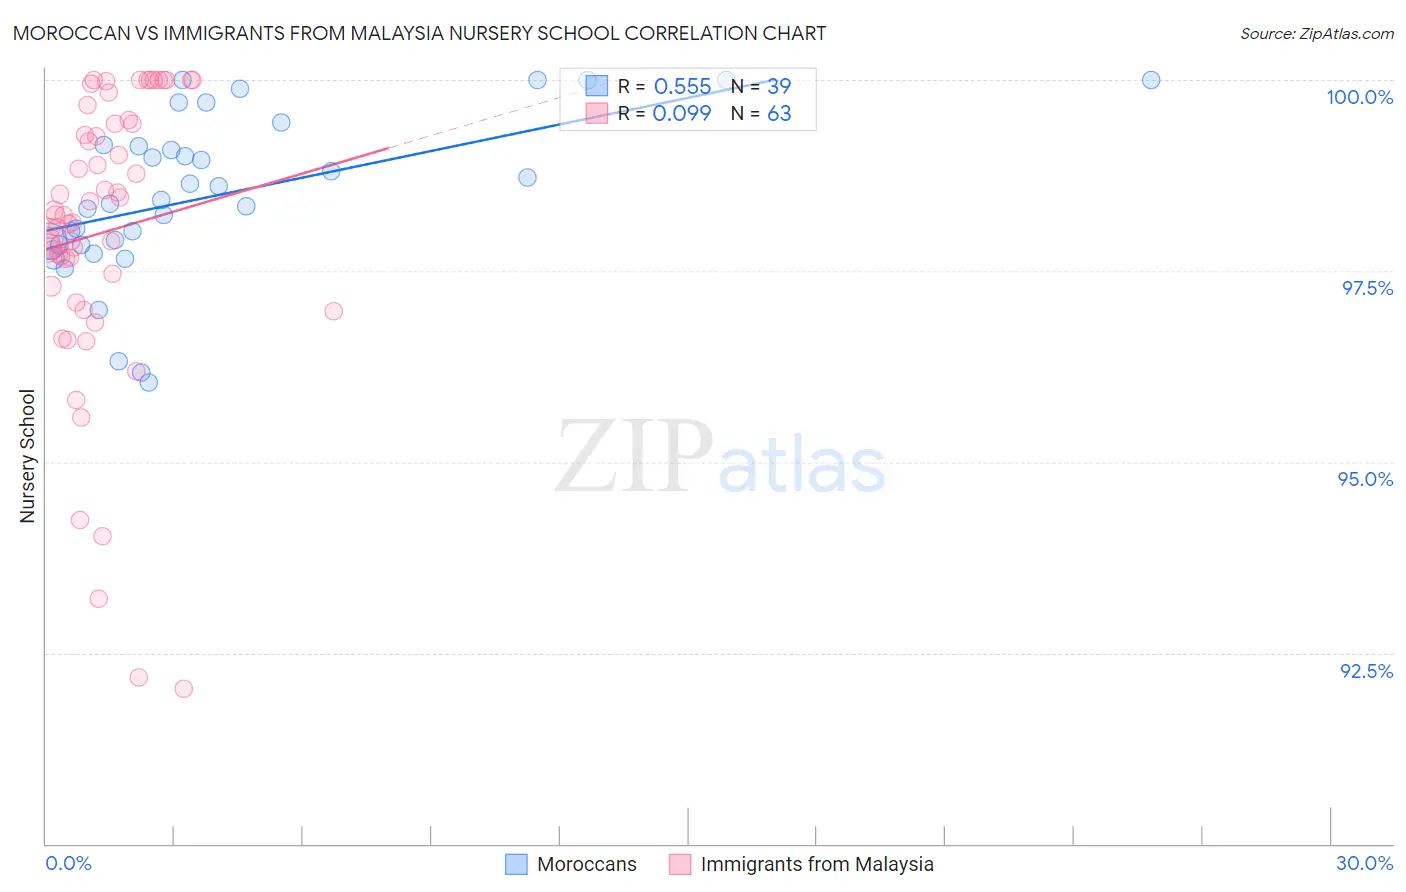
Moroccan vs Immigrants from Malaysia Nursery School Correlation Chart
The statistical analysis conducted on geographies consisting of 201,817,667 people shows a substantial positive correlation between the proportion of Moroccans and percentage of population with at least nursery school education in the United States with a correlation coefficient (R) of 0.555 and weighted average of 97.8%. Similarly, the statistical analysis conducted on geographies consisting of 197,973,709 people shows a slight positive correlation between the proportion of Immigrants from Malaysia and percentage of population with at least nursery school education in the United States with a correlation coefficient (R) of 0.099 and weighted average of 97.7%, a difference of 0.11%.
Nursery School Correlation Summary
| Measurement | Moroccan | Immigrants from Malaysia |
| Minimum | 96.0% | 92.0% |
| Maximum | 100.0% | 100.0% |
| Range | 4.0% | 8.0% |
| Mean | 98.5% | 98.0% |
| Median | 98.4% | 98.2% |
| Interquartile 25% (IQ1) | 97.8% | 97.3% |
| Interquartile 75% (IQ3) | 99.1% | 99.4% |
| Interquartile Range (IQR) | 1.3% | 2.1% |
| Standard Deviation (Sample) | 1.1% | 1.9% |
| Standard Deviation (Population) | 1.0% | 1.9% |
Similar Demographics by Nursery School
Demographics Similar to Moroccans by Nursery School
In terms of nursery school, the demographic groups most similar to Moroccans are Immigrants from Bahamas (97.8%, a difference of 0.0%), South American Indian (97.8%, a difference of 0.0%), Laotian (97.8%, a difference of 0.010%), Bahamian (97.8%, a difference of 0.010%), and Uruguayan (97.8%, a difference of 0.010%).
| Demographics | Rating | Rank | Nursery School |
| Immigrants | Albania | 16.4 /100 | #206 | Poor 97.9% |
| Africans | 15.4 /100 | #207 | Poor 97.9% |
| Immigrants | Northern Africa | 11.7 /100 | #208 | Poor 97.8% |
| Costa Ricans | 11.3 /100 | #209 | Poor 97.8% |
| Immigrants | Oceania | 10.2 /100 | #210 | Poor 97.8% |
| Laotians | 9.8 /100 | #211 | Tragic 97.8% |
| Immigrants | Bahamas | 8.6 /100 | #212 | Tragic 97.8% |
| Moroccans | 8.3 /100 | #213 | Tragic 97.8% |
| South American Indians | 8.0 /100 | #214 | Tragic 97.8% |
| Bahamians | 7.4 /100 | #215 | Tragic 97.8% |
| Uruguayans | 7.1 /100 | #216 | Tragic 97.8% |
| Samoans | 6.3 /100 | #217 | Tragic 97.8% |
| Immigrants | Panama | 5.3 /100 | #218 | Tragic 97.8% |
| Immigrants | Morocco | 5.1 /100 | #219 | Tragic 97.8% |
| Immigrants | Zaire | 4.4 /100 | #220 | Tragic 97.8% |
Demographics Similar to Immigrants from Malaysia by Nursery School
In terms of nursery school, the demographic groups most similar to Immigrants from Malaysia are Immigrants from Western Asia (97.7%, a difference of 0.0%), Immigrants from Uruguay (97.7%, a difference of 0.010%), U.S. Virgin Islander (97.7%, a difference of 0.010%), Colombian (97.7%, a difference of 0.010%), and Immigrants from Pakistan (97.7%, a difference of 0.010%).
| Demographics | Rating | Rank | Nursery School |
| Senegalese | 3.2 /100 | #229 | Tragic 97.7% |
| Sierra Leoneans | 2.9 /100 | #230 | Tragic 97.7% |
| Puerto Ricans | 2.6 /100 | #231 | Tragic 97.7% |
| Immigrants | Uruguay | 2.3 /100 | #232 | Tragic 97.7% |
| U.S. Virgin Islanders | 2.1 /100 | #233 | Tragic 97.7% |
| Colombians | 2.1 /100 | #234 | Tragic 97.7% |
| Immigrants | Pakistan | 2.1 /100 | #235 | Tragic 97.7% |
| Immigrants | Malaysia | 1.9 /100 | #236 | Tragic 97.7% |
| Immigrants | Western Asia | 1.9 /100 | #237 | Tragic 97.7% |
| Nigerians | 1.7 /100 | #238 | Tragic 97.7% |
| Immigrants | Eastern Asia | 1.6 /100 | #239 | Tragic 97.7% |
| Koreans | 1.4 /100 | #240 | Tragic 97.7% |
| Immigrants | Indonesia | 1.1 /100 | #241 | Tragic 97.7% |
| Liberians | 1.1 /100 | #242 | Tragic 97.7% |
| Asians | 1.1 /100 | #243 | Tragic 97.6% |